4 Chart animation
4 Chart animation4.1 experimental goals 4.2 experimental procedure4.3 experimental results4.4 experiment summary
4.1 experimental goals
In this lesson, you will learn how to animate a chart.
The reference code path for this experiment is :CanMV\04-GUI\chart_anime.py
4.2 experimental procedure
The factory firmware of the module has been integrated with the lvgl graphical library. If you have downloaded other firmware, please burn it back to the factory firmware before experimenting.
Import the relevant libraries and initialize the lvgl, register the display interface, and register the input interface.
Create a new animation class, Anim.
class Anim(lv.anim_t):def __init__(self, obj, val, size, exec_cb, path_cb, time=500, playback = False, ready_cb=None):super().__init__()lv.anim_init(self)lv.anim_set_time(self, time, 0)lv.anim_set_values(self, val, val+size)if callable(exec_cb):lv.anim_set_custom_exec_cb(self, exec_cb)else:lv.anim_set_exec_cb(self, obj, exec_cb)lv.anim_set_path_cb(self, path_cb )if playback: lv.anim_set_playback(self, 0)if ready_cb: lv.anim_set_ready_cb(self, ready_cb)lv.anim_create(self)
Create a new animated chart class, AnimatedChart.
xclass AnimatedChart(lv.chart):def __init__(self, parent, val, size):super().__init__(parent)self.val = valself.size = sizeself.max = 2000self.min = 500self.factor = 100self.anim_phase1()def anim_phase1(self):Anim(self,self.val,self.size,lambda a, val: self.set_range(0, val),lv.anim_path_ease_in,ready_cb=lambda a:self.anim_phase2(),time=(self.max * self.factor) // 100)def anim_phase2(self):Anim(self,self.val+self.size,-self.size,lambda a, val: self.set_range(0, val),lv.anim_path_ease_out,ready_cb=lambda a:self.anim_phase1(),time=(self.min * self.factor) // 100)
Configure the parameters for the animated chart.
xxxxxxxxxxscr = lv.obj()chart = AnimatedChart(scr, 100, 1000)chart.set_width(scr.get_width() - 100)chart.set_height(scr.get_height() - 60)chart.align(scr, lv.ALIGN.CENTER, 0, 0)series1 = chart.add_series(lv.color_hex(0xFF0000))chart.set_type(chart.TYPE.POINT | chart.TYPE.LINE)chart.set_series_width(3)chart.set_range(0,100)chart.init_points(series1, 10)chart.set_points(series1, [10,20,35,20,10,40,51,90,95,80])chart.set_x_tick_texts('a\nb\nc\nd\ne', 2, lv.chart.AXIS.DRAW_LAST_TICK)chart.set_x_tick_length(10, 5)chart.set_y_tick_texts('1\n2\n3\n4\n5', 2, lv.chart.AXIS.DRAW_LAST_TICK)chart.set_y_tick_length(10, 5)chart.set_div_line_count(3, 3)chart.set_margin(30)
Create a new slider to change the speed at which the animation changes.
xxxxxxxxxxdef on_slider_changed(self, obj=None, event=-1):chart.factor = slider.get_value()slider = lv.slider(scr)slider.align(chart, lv.ALIGN.OUT_RIGHT_TOP, 10, 0)slider.set_width(30)slider.set_height(chart.get_height())slider.set_range(10, 200)slider.set_value(chart.factor, 0)slider.set_event_cb(on_slider_changed)
Load the lvgl project object. Since the images of the lvgl need to be updated in real time, the tasks of the lvgl need to be refreshes every 5 milliseconds.
xxxxxxxxxxlv.scr_load(scr)tim = time.ticks_ms()while True:if time.ticks_ms()-tim > 5:tim = time.ticks_ms()lv.task_handler()lv.tick_inc(5)
4.3 experimental results
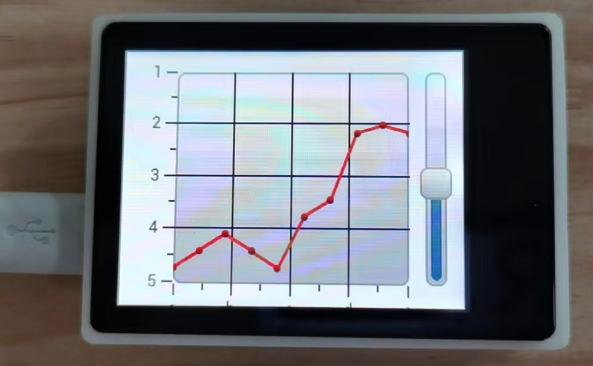
Connect the K210 module to the computer through the microUSB data cable, CanMV IDE click the connect button, after the connection is completed click the Run button to run the routine code. You can also download the code as main.py and run it in the K210 module.
You can see that a chart is displayed in the middle of the LCD screen, and the curve in the chart will change. You can change the speed of the curve in the chart by sliding the slider on the right.
4.4 experiment summary
Animating a chart is a complex task, so you'll need to create two new animation-related classes to store the corresponding parameter information. The slider changes the rate at which the animation takes place. It doesn't take effect until the slider has finished animating, that is, until all the curves have reached their lowest point.