6. Gaussian mean filter
6.1. Gaussian mean filter
Filtering: It is a basic task in signal and image processing. Its purpose is to selectively extract certain information in the image that is considered important, depending on the application environment. Filtering can remove noise from the image, extract visual features of interest, allow image resampling, etc.
Frequency domain analysis: Divide the image into different parts from low frequency to high frequency. Low frequency corresponds to the area where the image intensity changes little, while high frequency is the area where the image intensity changes very much.
In the framework of the field of frequency analysis, a filter is an operation used to enhance a certain band or frequency in the image and block (or reduce) other frequency bands. A low-pass filter eliminates the high-frequency part of the image but retains the low-frequency part. A high-pass filter eliminates the low-frequency part.
Filtering (high-pass, low-pass, band-pass, band-stop), blurring, denoising, smoothing, etc.
Gaussian blur is essentially a mean blur, but Gaussian blur is based on weighted average. The closer the distance, the greater the weight, and the farther the distance, the smaller the weight.
In layman's terms, Gaussian filtering is the process of weighted averaging the entire image. The value of each pixel is obtained by weighted averaging itself and other pixel values in the neighborhood.
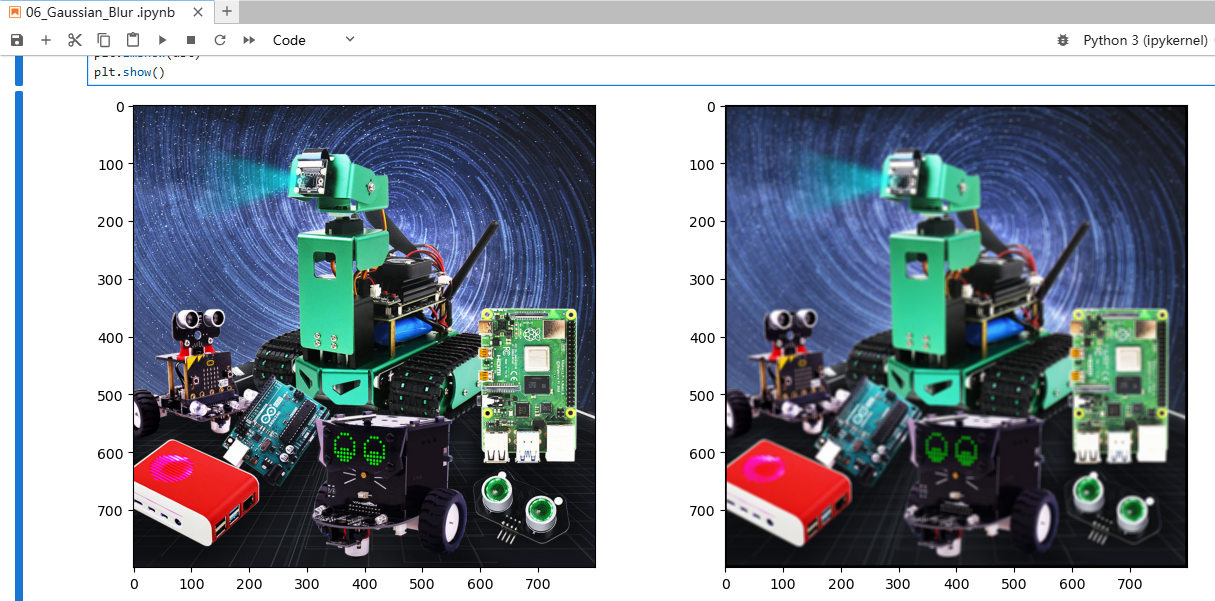
6.2 Actual effect display
Source code path:
/home/pi/Rider-pi_class/4.Open Source CV/D.Image_Enhancement/01_Color_Image_Histogram.ipynb
ximport cv2import numpy as npimport matplotlib.pyplot as pltimg = cv2.imread('yahboom.jpg',1)# cv2.imshow('src',img)dst = cv2.GaussianBlur(img,(5,5),1.5)# cv2.imshow('dst',dst)# cv2.waitKey(0)img = cv2.cvtColor(img, cv2.COLOR_BGR2RGB)dst = cv2.cvtColor(dst, cv2.COLOR_BGR2RGB)plt.figure(figsize=(14, 6), dpi=100) #设置绘图区域的大小和像素 Set the size and pixels of the drawing areaplt.subplot(121) # 一行二列第一个 The first row and second columnplt.imshow(img)plt.subplot(122) # 一行二列第二个 The second row, second columnplt.imshow(dst)plt.show()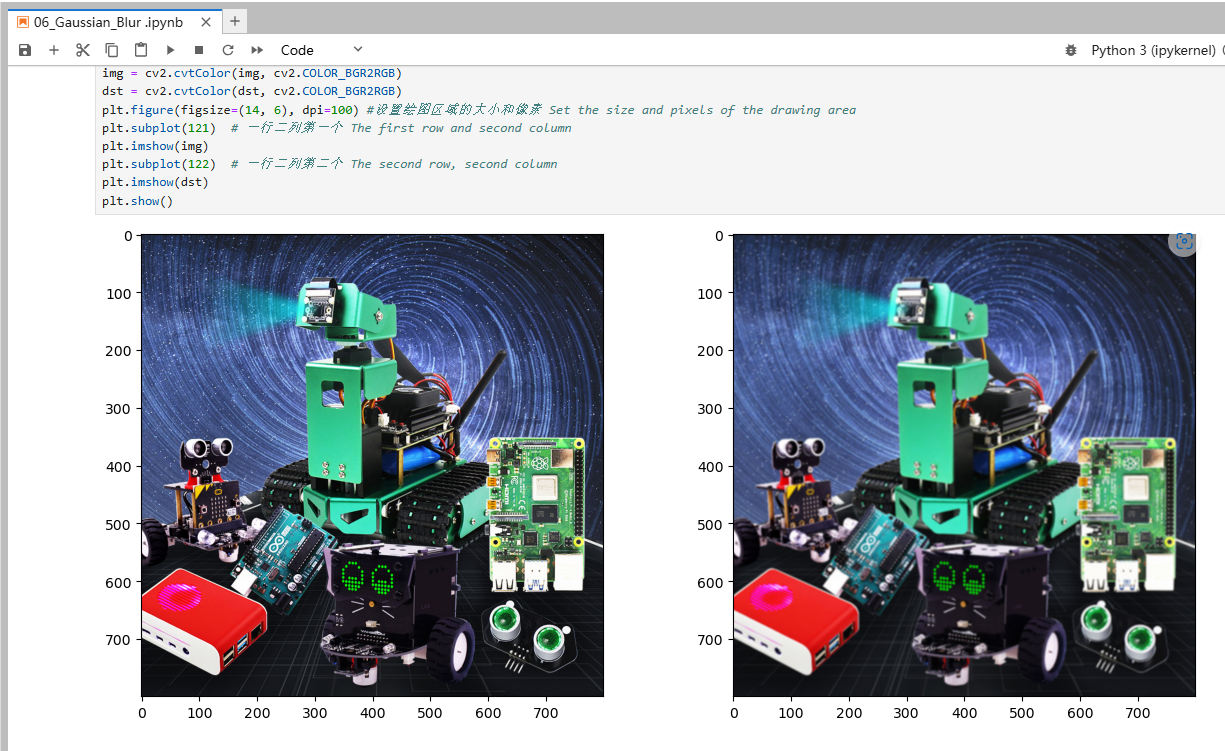
xxxxxxxxxximport cv2import numpy as npimport matplotlib.pyplot as pltimg = cv2.imread('yahboom.jpg',1)# cv2.imshow('src',img)imgInfo = img.shapeheight = imgInfo[0]width = imgInfo[1]dst = np.zeros((height,width,3),np.uint8)for i in range(3,height-3): for j in range(3,width-3): sum_b = int(0) sum_g = int(0) sum_r = int(0) for m in range(-3,3):#-3 -2 -1 0 1 2 for n in range(-3,3): (b,g,r) = img[i+m,j+n] sum_b = sum_b+int(b) sum_g = sum_g+int(g) sum_r = sum_r+int(r) b = np.uint8(sum_b/36) g = np.uint8(sum_g/36) r = np.uint8(sum_r/36) dst[i,j] = (b,g,r)# cv2.imshow('dst',dst)# cv2.waitKey(0)img = cv2.cvtColor(img, cv2.COLOR_BGR2RGB)dst = cv2.cvtColor(dst, cv2.COLOR_BGR2RGB)plt.figure(figsize=(14, 6), dpi=100) #设置绘图区域的大小和像素 Set the size and pixels of the drawing areaplt.subplot(121) # 一行二列第一个 The first row and second columnplt.imshow(img)plt.subplot(122) # 一行二列第二个 The second row, second columnplt.imshow(dst)plt.show()