1. Image resizing
In OpenCV, the function that implements image scaling is: cv2.resize(InputArray src, OutputArray dst, Size, fx, fy, interpolation)
The code is running on jupyter lab
Parameter explanation:
| InputArray src | Input image |
|---|---|
| OutputArray dst | Output picture |
| Size | Output image size |
| fx, fy | Scaling factors along the x-axis, y-axis |
| interpolation | insertion method |
Interpolation method used by the interpolation option:
| INTER_NEAREST | Nearest neighbor interpolation |
|---|---|
| INTER_LINEAR | Bilinear interpolation (default setting) |
| INTER_AREA | Resampling using pixel area relationships. |
| INTER_CUBIC | Bicubic interpolation of 4x4 pixel neighborhoods |
| INTER_LANCZOS4 | Lanczos interpolation of 8x8 pixel neighborhoods |
Notice:
- The output size format is (width, height)
- The default interpolation method is: bilinear interpolation
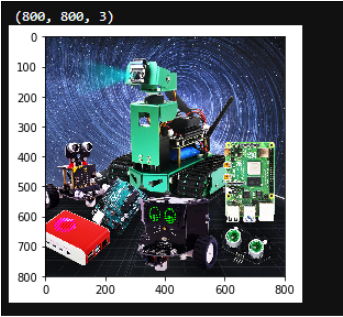
x# 1 load 2 info 3 resize 4 checkimport cv2import matplotlib.pyplot as plt # Python's 2D drawing library# Read in the original imageimg = cv2.imread('yahboom.jpg')#Print the image sizeprint(img.shape)#Assign the height and width of the image to x and y respectivelyx, y = img.shape[0:2]# Show original image#cv.imshow('OriginalPicture', img)# Scale to one-half of the original size, and the output size format is (width, height)img_test1 = cv2.resize(img, (int(y / 2), int(x / 2)))# cv2.imshow('resize0', img_test1)#cv2.waitKey()# Nearest neighbor interpolation scaling# Zoom to a quarter of the original sizeimg_test2 = cv2.resize(img, (0, 0), fx=0.25, fy=0.25, interpolation=cv2.INTER_NEAREST)# cv.imshow('resize1', img_test2)#cv.waitKey()#cv.destroyAllWindows()img = cv2.cvtColor(img, cv2.COLOR_BGR2RGB)dst1 = cv2.cvtColor(img_test1, cv2.COLOR_BGR2RGB)dst2 = cv2.cvtColor(img_test2, cv2.COLOR_BGR2RGB)# show original imageplt.imshow(img)plt.show()
After execution, you can see that the image is 800*800
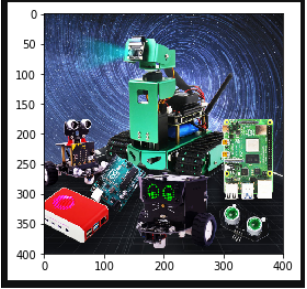
xxxxxxxxxx# Display zoom 1/2plt.imshow(dst1)plt.show()
After execution, you can see that the image is 400*400, scaled by half.
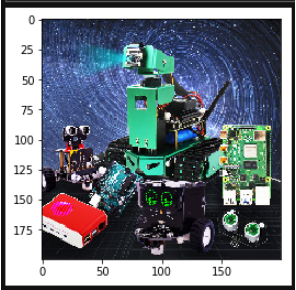
xxxxxxxxxx#Display scaling 1/4 neighbor interpolation scalingplt.imshow(dst2)plt.show()
After execution, you can see that the image is 200*200, scaled by a quarter.
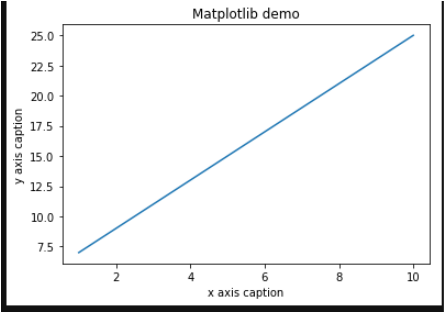
Next let’s talk about matplotlib: Python’s 2D drawing library.
Reference tutorial: https://www.runoob.com/numpy/numpy-matplotlib.html
xxxxxxxxxximport numpy as npfrom matplotlib import pyplot as pltx = np.arange(1,11)y=2*x+5plt.title("Matplotlib demo")plt.xlabel("x axis caption")plt.ylabel("y axis caption")plt.plot(x,y)plt.show()