3、edge detection
The purpose of edge detection is to significantly reduce the data size of the image while retaining the original image attributes. There are currently many algorithms for edge detection. Although the Canny algorithm is old, it can be said that it is a standard algorithm for edge detection and is still widely used in research.
Canny edge detection is a technology that extracts useful structural information from different visual objects and greatly reduces the amount of data to be processed. It has been widely used in various computer vision systems. Canny found that the requirements for edge detection on different vision systems are relatively similar. Therefore, an edge detection technology with broad application significance can be implemented. General standards for edge detection include:
- Detect edges with a low error rate, which means capturing as many edges as possible in the image as accurately as possible.
- The detected edge should be accurately positioned at the center of the real edge.
- A given edge in the image should be marked only once, and where possible, noise in the image should not produce false edges.
To meet these requirements, Canny uses the calculus of variations. The optimal function in the Canny detector is described by the sum of four exponential terms, which can be approximated by the first derivative of the Gaussian function.
Among the currently commonly used edge detection methods, the Canny edge detection algorithm is one of the strictly defined methods that can provide good and reliable detection. Because it has the advantages of meeting the three criteria of edge detection and being simple to implement, it has become one of the most popular algorithms for edge detection.
The Canny edge detection algorithm can be divided into the following 5 steps:
- Use Gaussian filter to smooth the image and filter out noise.
- Calculate the gradient intensity and direction of each pixel in the image.
- Apply non-maximum suppression to eliminate spurious responses caused by edge detection.
- Apply Double-Threshold detection to determine real and potential edges.
- Finally complete edge detection by suppressing isolated weak edges.
The code was run on jupyterlab
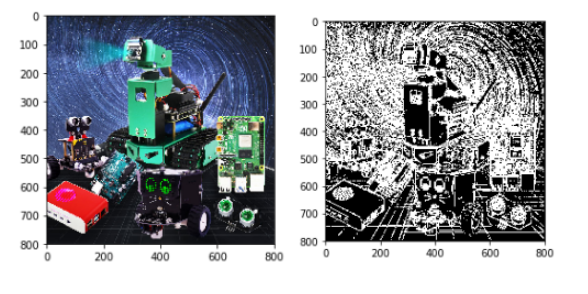
x#method 1import cv2import numpy as npimport randomimport matplotlib.pyplot as pltimg = cv2.imread('image0.jpg',1)imgInfo = img.shapeheight = imgInfo[0]width = imgInfo[1]#cv2.imshow('src',img)#canny 1 gray 2 gaussian 3 cannygray = cv2.cvtColor(img,cv2.COLOR_BGR2GRAY)imgG = cv2.GaussianBlur(gray,(3,3),0)dst = cv2.Canny(img,50,50) #Picture convolution——》th# cv2.imshow('dst',dst)#cv2.waitKey(0)
Compare two pictures
xxxxxxxxxximg_bgr2rgb1 = cv2.cvtColor(img, cv2.COLOR_BGR2RGB)plt.imshow(img_bgr2rgb1)plt.show()
xxxxxxxxxximg_bgr2rgb1 = cv2.cvtColor(dst, cv2.COLOR_BGR2RGB)plt.imshow(img_bgr2rgb1)plt.show()
Code path: /home/pi/Yahboom_Project/1.OpenCV course/03 Image processing and drawing text line segments/03_2 Edge detection 2.ipynb
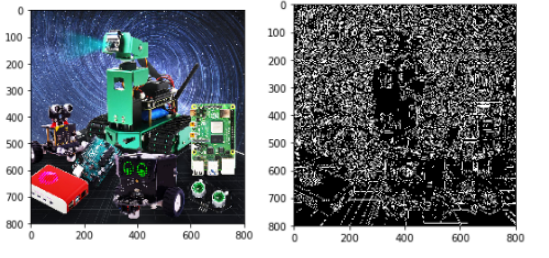
xxxxxxxxxx#method2import cv2import numpy as npimport randomimport mathimg = cv2.imread('image0.jpg',1)imgInfo = img.shapeheight = imgInfo[0]width = imgInfo[1]#cv2.imshow('src',img)# sobel 1 operator template 2 image convolution 3 threshold decision# [1 2 1 [ 1 0 -1# 0 0 0 2 0 -2# -1 -2 -1 ] 1 0 -1 ]# [1 2 3 4] [a b c d] a*1+b*2+c*3+d*4 = dst# sqrt(a*a+b*b) = f>thgray = cv2.cvtColor(img,cv2.COLOR_BGR2GRAY)dst = np.zeros((height,width,1),np.uint8)for i in range(0,height-2):for j in range(0,width-2):gy = gray[i,j]*1+gray[i,j+1]*2+gray[i,j+2]*1-gray[i+2,j]*1-gray[i+2, j+1]*2-gray[i+2,j+2]*1gx = gray[i,j]+gray[i+1,j]*2+gray[i+2,j]-gray[i,j+2]-gray[i+1,j+2]*2 -gray[i+2,j+2]grad = math.sqrt(gx*gx+gy*gy)ifgrad>50:dst[i,j] = 255else:dst[i,j] = 0# cv2.imshow('dst',dst)#cv2.waitKey(0)
xxxxxxxxxximport matplotlib.pyplot as pltimg_bgr2rgb1 = cv2.cvtColor(img, cv2.COLOR_BGR2RGB)plt.imshow(img_bgr2rgb1)plt.show()
xxxxxxxxxximg_bgr2rgb1 = cv2.cvtColor(dst, cv2.COLOR_BGR2RGB)plt.imshow(img_bgr2rgb1)plt.show()