Program download and simulation
Program download and simulation1、FlyMCU:Program download1.1、Generate.hex files1.2、Downloading the program1.3、Running the program2、ST-Link:Program download and simulation2.1、Debug configuration2.2、Program download2.3、Program simulation
1、FlyMCU:Program download
FlyMCU software can download the compiled program code (hex file) to the target MCU chip through the serial port.
1.1、Generate.hex files
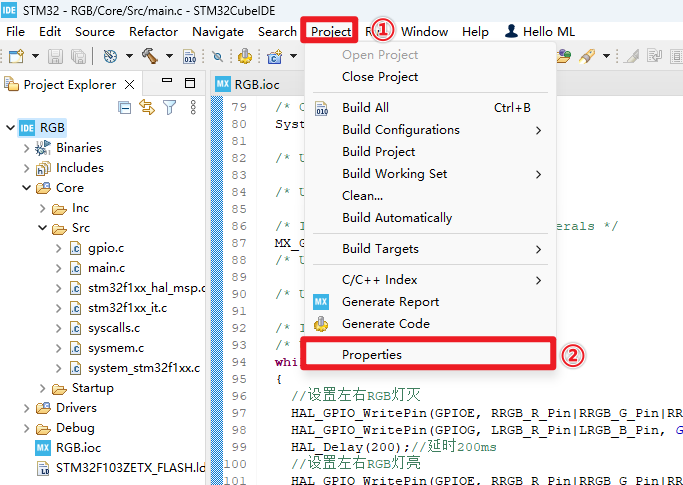
Using STM32CubeIDE will not generate.hex files by default,You need to check the appropriate option.
Properties
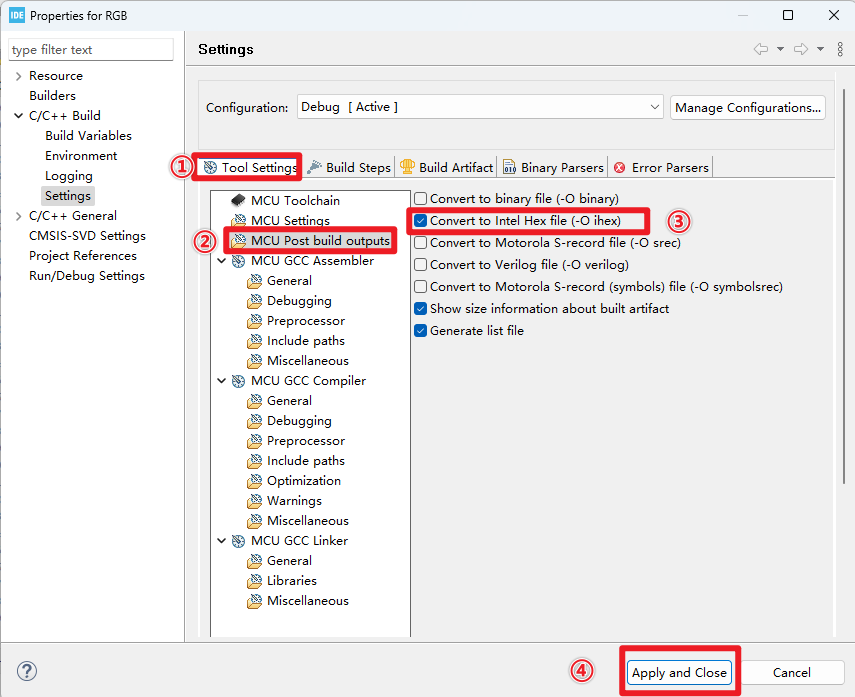
Check the appropriate options
compilation
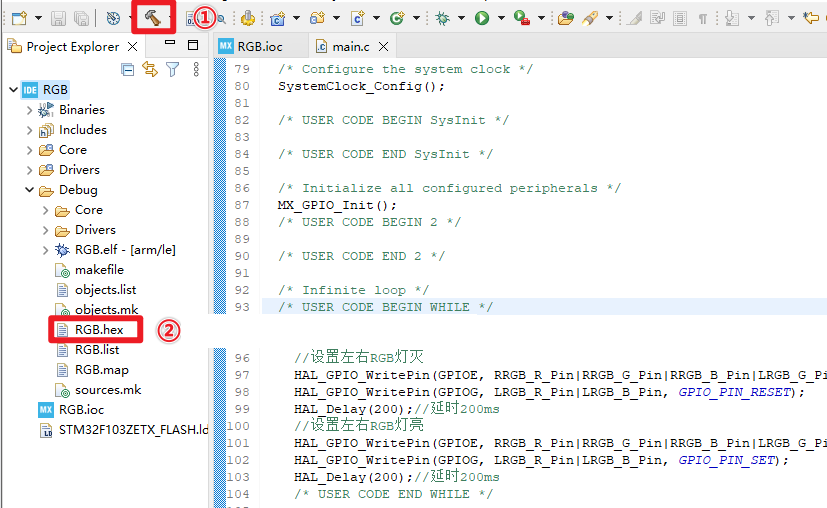
.hex file location: Debug folder of the project file
1.2、Downloading the program
Using the data line can be through the development board Type-C interface burning program;
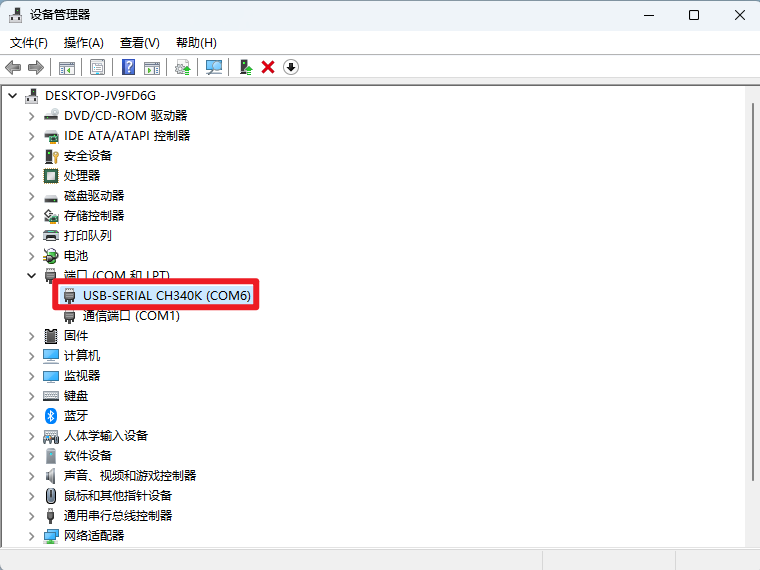
After connecting the computer with Type-C data cable, you can check the serial port number of the corresponding device in the device manager: port.
Device Manager
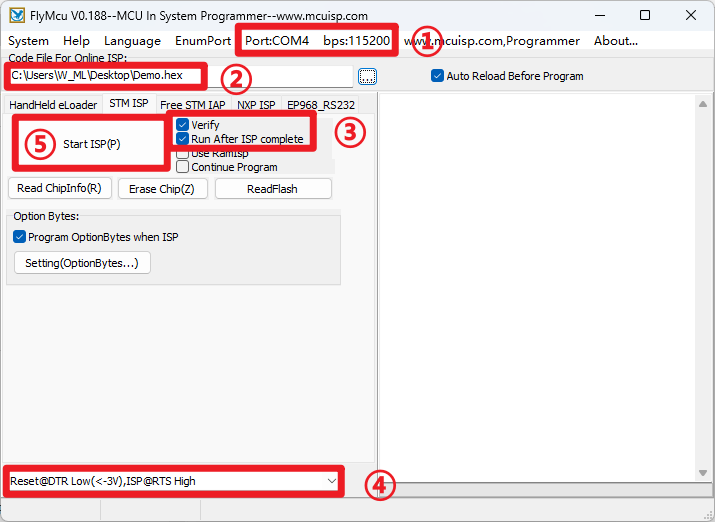
Flymcu
BootLoader options:DTR low reset, RTS high reset into BootLoader
1.3、Running the program
After downloading the program successfully, press the RESET button of the development board to observe whether the phenomenon of the development board is normal.
2、ST-Link:Program download and simulation
To download a program using ST-Link, you need to check and set the debugger to ST-Link.
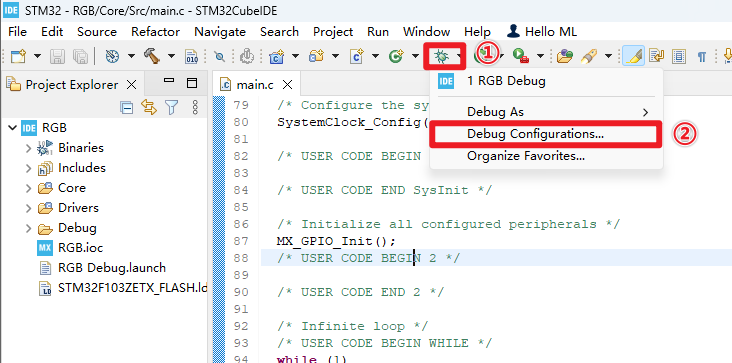
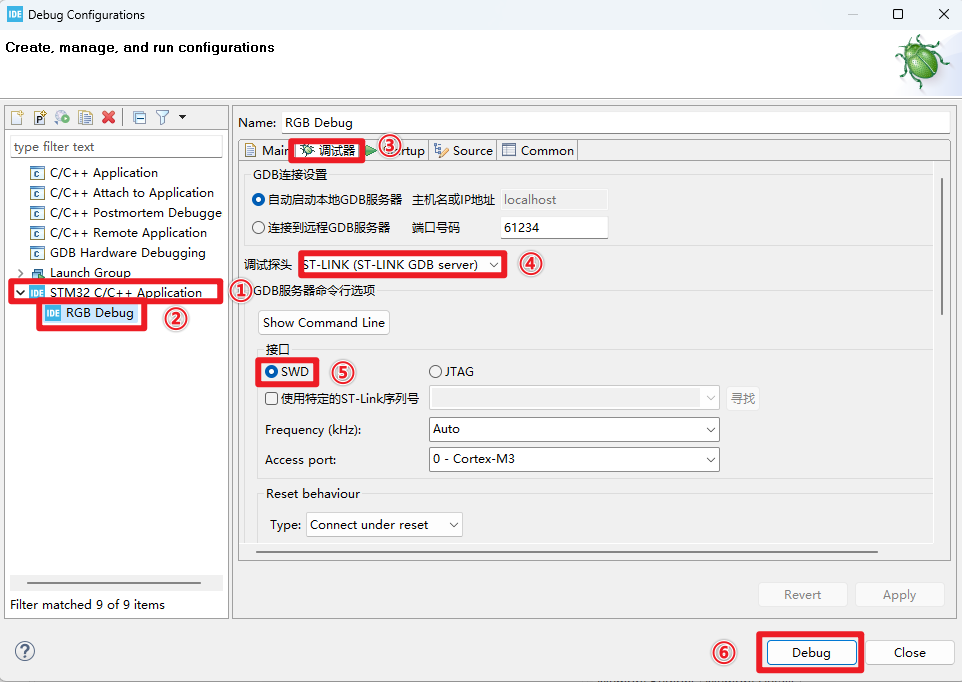
2.1、Debug configuration
ST-Link → SWD
Hardware wiring
Before using ST-Link to download programs, you need to use four mother-to-mother dupont wires to connect the ST-Link to the development board, and the ST-Link is connected to the computer through a USB interface.
| ST-Link | The SWD interface of the board |
|---|---|
| 3.3V | 3V3 |
| SWCLK | SWCLK |
| SWDIO | SWDIO |
| GND | GND |
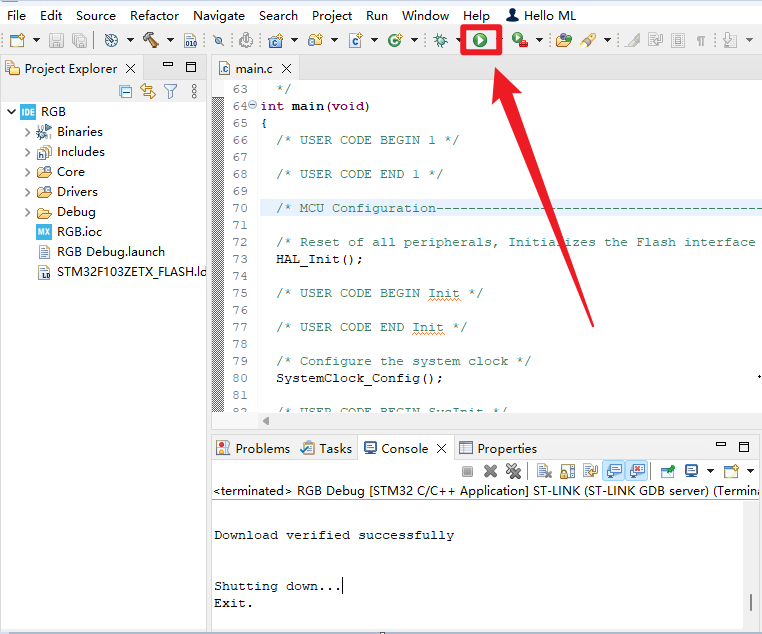
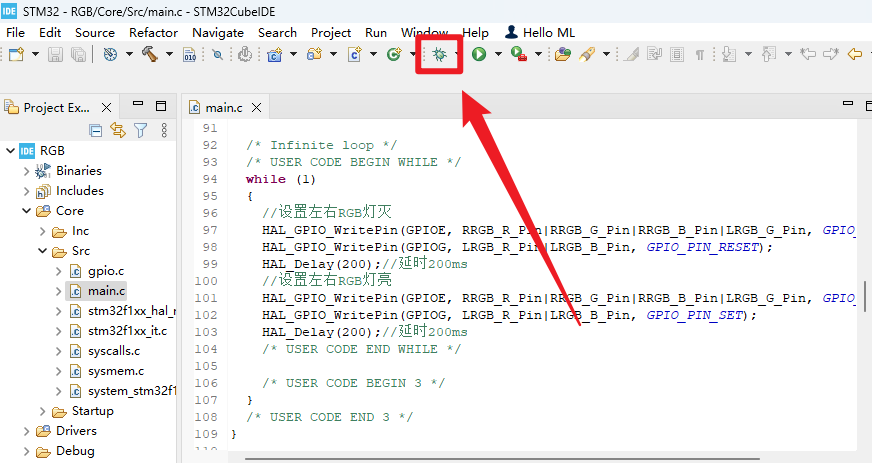
2.2、Program download
Click the Debug icon
2.3、Program simulation
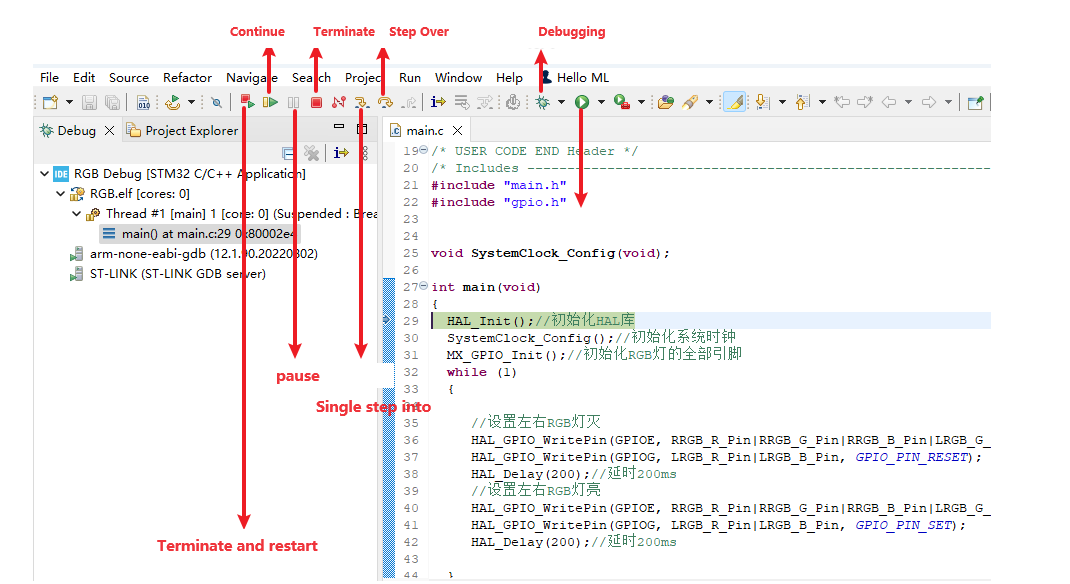
Debug:Click on "Little Beetle"
Breakpoint debugging
Viewing variable values
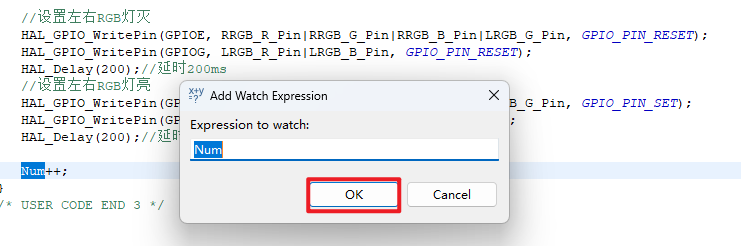
In debug mode, select the Num variable you want to view (here's how to view the Num variable)
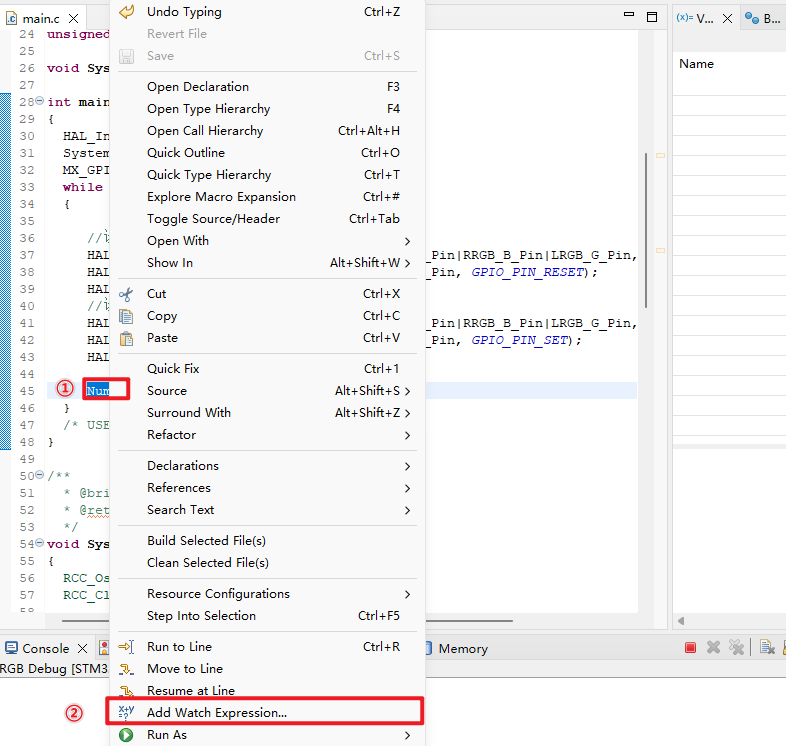
xxxxxxxxxxVariables can be added to the Expression window by right-clicking and selecting the appropriate option, or by manually entering the variable name
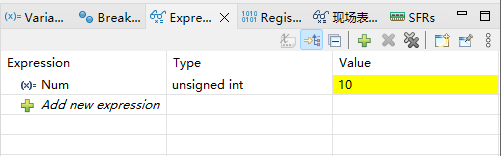
When the Num variable is added to the Express window, the value can be viewed in the Expression window, and the actual value of the variable is displayed only when the program is stopped
xxxxxxxxxxThe live expression window allows you to view the changes of global variables in real time
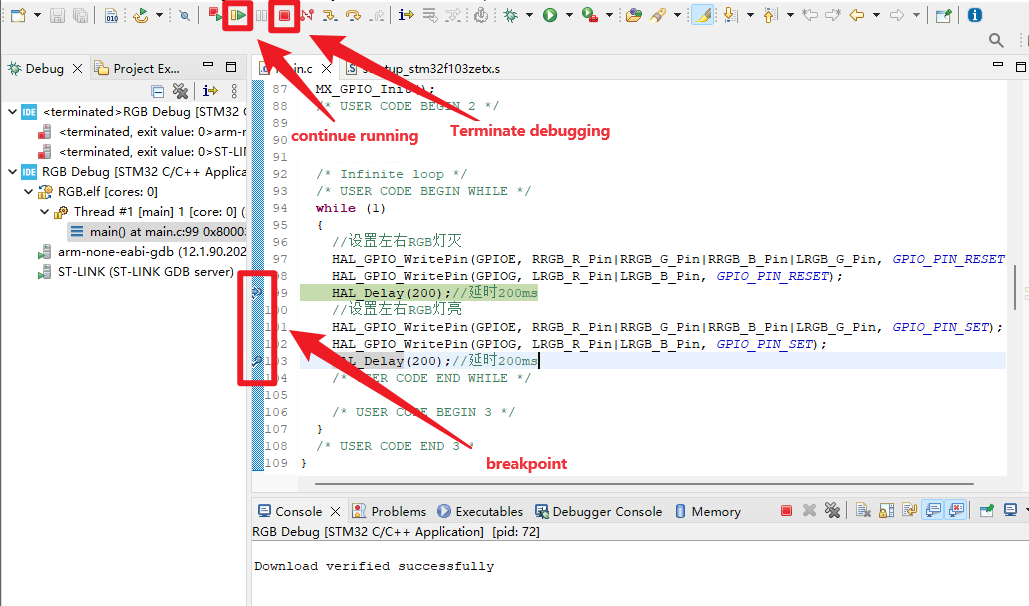
Breakpoint:Double-click on the leftmost part of the current statement to show a blue breakpoint, where the program stops running
Keep running:When the program runs to the breakpoint position, you can use this button to continue running down
Terminate debugging:Exit program debugging