Line segment drawing
When processing images with OpenCV, we sometimes need to draw line segments, rectangles, etc. on the image.
In OpenCV, we use the line(dst, pt1, pt2, color, thickness=None, lineType=None, shift=None) function to draw line segments.
Parameter Description:
dst: Output image.
pt1,pt2:Required parameter. The coordinate points of the line segment, representing the starting point and the end point respectively.
color: Required parameter. Used to set the color of the line segment.
thickness: Optional parameter. Used to set the width of the line segment.
lineType:Optional parameter.
Used to set the type of line segment, optional 8 (8 adjacent connecting lines - default), 4 (4 adjacent connecting lines) and cv2.LINE_AA for anti-aliasing
Code path:
x~/dofbot_pro/dofbot_opencv/scripts/3.draw_picture/04_draw_line.ipynb
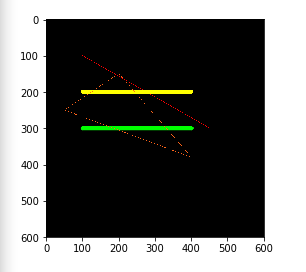
ximport cv2import numpy as npimport matplotlib.pyplot as pltnewImageInfo = (600, 600, 3)dst = np.zeros(newImageInfo,np.uint8)
# line# Draw a line segment 1 dst 2 begin 3 end 4 colorcv2.line(dst, (100,100), (450,300), (0,0,255))# 5 line wcv2.line(dst, (100,200), (400,200), (0,255,255), 10)# 6 line typecv2.line(dst, (100,300), (400,300), (0,255,0), 10, cv2.LINE_AA)
cv2.line(dst, (200,150), (50,250), (25,100,255))cv2.line(dst, (50,250), (400,380), (25,100,255))cv2.line(dst, (400,380), (200,150), (25,100,255))
# cv2.imshow('dst',dst)# cv2.waitKey(0)dst = cv2.cvtColor(dst, cv2.COLOR_BGR2RGB)plt.imshow(dst) plt.show()