Open the Resource Monitoring Panel
introduce
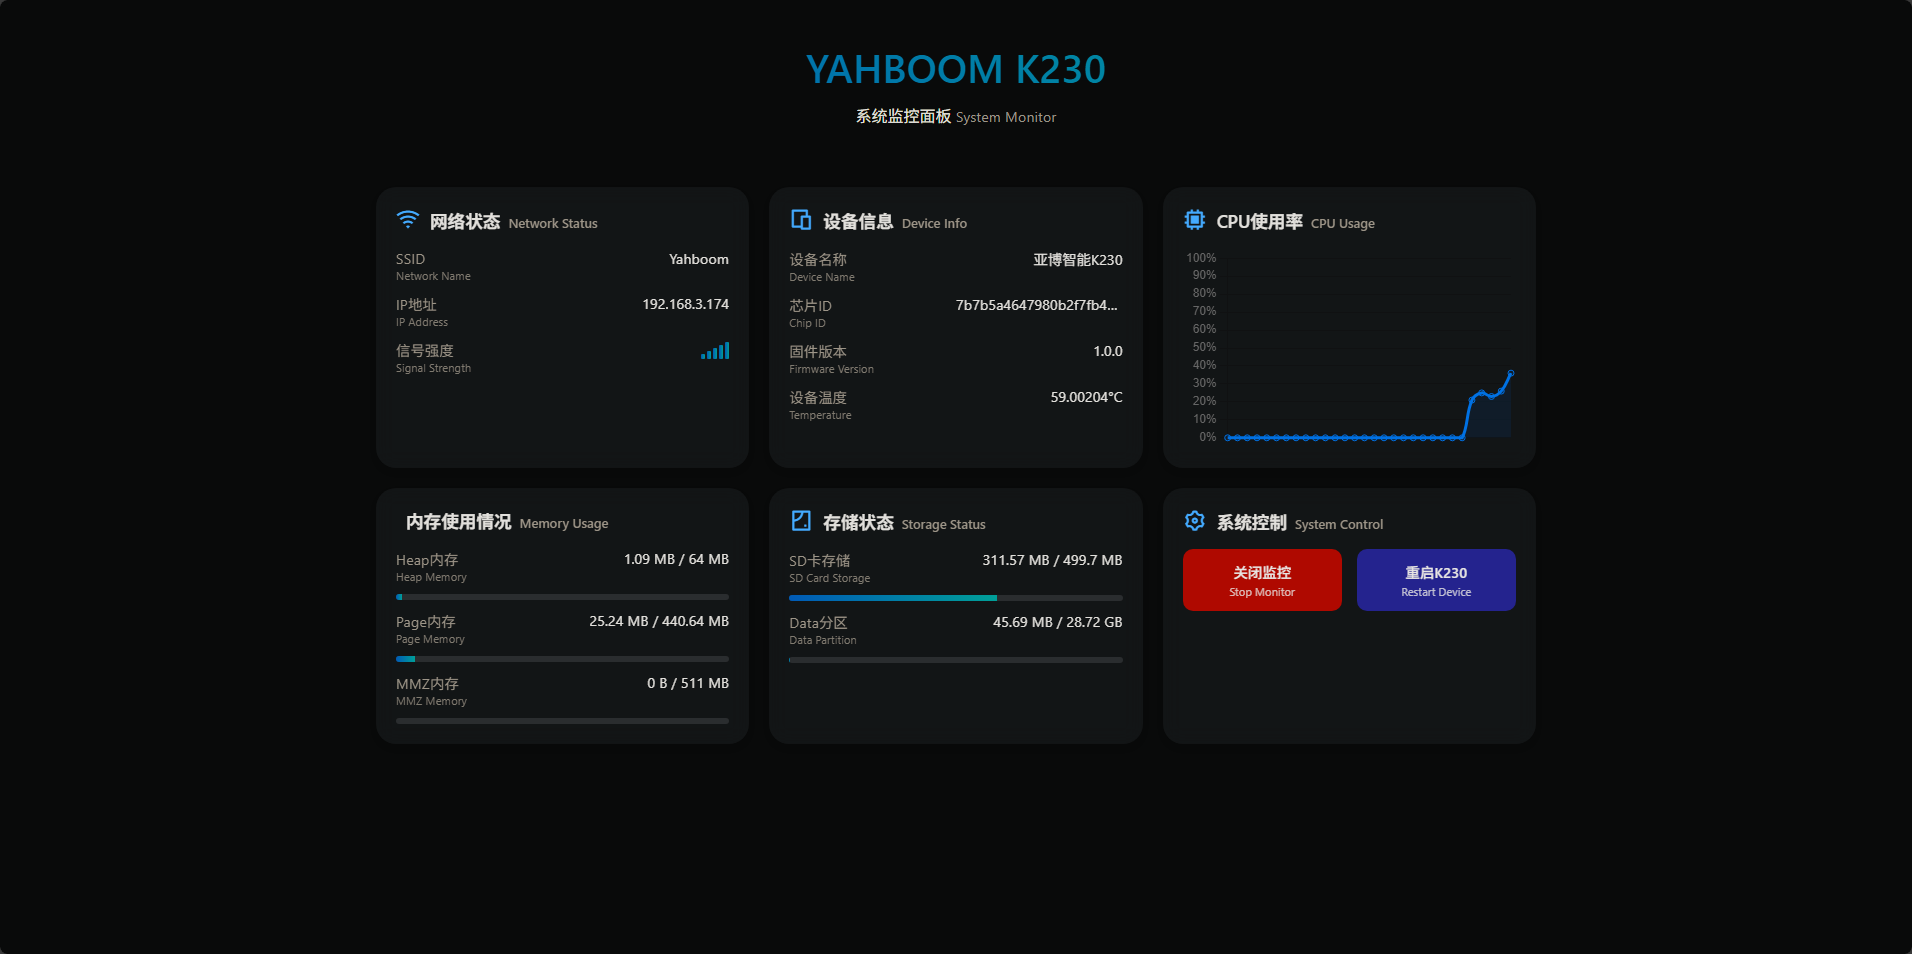
YAHBOOM K230 has a built-in visual resource monitoring panel, which needs to be opened in a WIFI environment
The effect is as follows
run
The example code of this section is located in [Source Code Summary/11.Network/09.Monitor/monitor.py]
import ybUtils.monitor as monitormonitor.run("[WIFI SSID]", "[WIFI PASSWORD]")We run this code on K230, and normally we will see the following output in the console
MPY: soft reboot[WIFI] WIFI connecting.... wifi connecting...[Monitor] WIFI connection successfulConnect success![Monitor] Starting server running server...[Monitor] Server started successfully K230 SERVER RUNIGN ON http://192.168.3.174:8082/Then we use a mobile phone or computer with the same WIFI as K230 to open the browser
Enter http://192.168.3.174:8082/ in the address bar and press Enter
Note that the address here is the information output in the console, and the address information printed by each person is different
Extended Operations
Asynchronous Execution
The system monitoring panel code is executed in a multi-threaded manner.
So you can insert this code to start the resource monitoring panel in any code
This operation has a certain degree of difficulty
But please note:
- Due to the computing resource limitations of K230, running the Resource Monitoring Panel in more complex code may cause the system to freeze.
- Micropython's multithreading mechanism is non-preemptive software multithreading, so in your original code, you must add time.sleep(1) in the loop to manually release CPU resources, otherwise the resource monitoring panel will not be able to obtain CPU execution permissions, resulting in the panel being unable to access normally.
API
The information in the Resource Monitoring Panel is essentially
xxxxxxxxxxhttp://192.168.3.174:8082/status
The original return value obtained by the interface is as follows
xxxxxxxxxx{ "wifi_mode": "sta", "temperature": 56.30499, "page_memory": { "available": 435601408, "total": 462045184 }, "chip_id" : "7b7b5a4647980b2f7fb489196b8539e10167270eaed625fa260b83a8be848e18" , "mmz_memory": { "available": 535822336, "total": 535822336 }, "device_name" : "亚博智能K230" , "sdcard_storage": { "available": 197263360, "total": 523968512 }, "data_storage": { "available": 30789533696, "total": 30837440512 }, "wifi_ip": "192.168.3.174", "wifi_signal": -49, "wifi_ssid": "Yahboom", "firmware_version": "1.0.0", "heap_memory": { "available": 65962464, "total": 67108864 }, "cpu_usage": 27}You can obtain the operation information of K230 by calling this interface.