5、Rectangle and circle drawing
- Drawing of rectangle
rectangle (img, pt1, pt2, color, thickness=None, lineType=None, shift=None)
Parameter Description:
l img: canvas or carrier image.
l pt1, pt2: required parameters. The vertices of the rectangle represent the vertex and the diagonal vertex respectively, that is, the upper left corner and the lower right corner of the rectangle (these two vertices can determine a unique rectangle)
l color: required parameter. Used to set the color of the rectangle
l thickness: optional parameter. Used to set the width of the rectangular side. When the value is a negative number, it means filling the rectangle.
l lineType: optional parameter. Used to set the type of line segment, optional 8 (8 adjacent connecting lines - default), 4 (4 adjacent connecting lines) and cv2.LINE_AA is anti-aliasing
- Drawing of circles
cv2.circle(img, center, radius, color[,thickness[,lineType]])
Parameter Description:
l img: canvas or carrier image
l center: is the coordinate of the center of the circle, format: (50,50)
l radius: radius
l color: color
l thickness: line thickness. Defaults to 1. If -1, fill solid.
l lineType: line type. The default is 8, connection type. The following table explains
| Parameters | Description |
|---|---|
| cv2.FILLED | fill |
| cv2.LINE_4 | 4 connection types |
| cv2.LINE_8 | 8 connection type |
| cv2.LINE_AA | Anti-aliasing, this parameter will make the lines smoother |
- Draw an ellipse
cv2.ellipse(img, center, axes, angle, StartAngle, endAngle, color[,thickness[,lineType]])
l center: center point of the ellipse, (x, x)
l axes: refers to the short radius and long radius, (x, x)
l angle: refers to the angle of counterclockwise rotation
l StartAngle: The angle of the starting angle of the arc
l endAngle: the angle of the arc’s end angle
l img and color can refer to the description of the circle.
# The fifth parameter refers to the angle at which the drawing starts counterclockwise, and the sixth parameter refers to the angle at which the drawing ends counterclockwise.
# If the 456 parameter is added with a sign, it represents the opposite direction, that is, clockwise.
- Draw polygons
cv2.polylines(img,[pts],isClosed, color[,thickness[,lineType]])
l pts: vertices of polygon
l isClosed: Whether it is closed. (True/False)
l Other parameters refer to the drawing parameters of the circle.
The code was run on jupyterlab
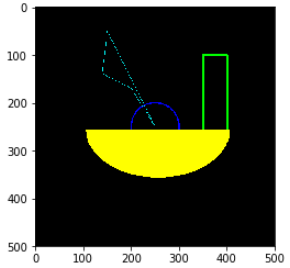
ximport cv2import numpy as npnewImageInfo = (500,500,3)dst = np.zeros(newImageInfo,np.uint8)# 1 2 upper left corner 3 lower right corner 4 5 fill -1 >0 line wcv2.rectangle(dst,(350,100),(400,270),(0,255,0),3)# 2 center 3 rcv2.circle(dst,(250,250),(50),(255,0,0),2)# 2 center 3 axis 4 angle 5 begin 6 end 7cv2.ellipse(dst, (256,256), (150,100), 0, 0, 180, (0,255,255), -1)points = np.array([[150,50], [140,140], [200,170], [250,250], [150,50]], np.int32)#print(points.shape)points = points.reshape((-1,1,2))#print(points.shape)cv2.polylines(dst,[points],True,(255,255,0))# cv2.imshow('dst',dst)#cv2.waitKey(0)
xxxxxxxxxximport matplotlib.pyplot as pltdst = cv2.cvtColor(dst, cv2.COLOR_BGR2RGB)plt.imshow(dst)plt.show()