20.ROS2 rviz2 use
1. Introduction to Rviz2
In the process of robot development, there are various functions. If we only analyze from the data level, it will be difficult to quickly understand the effect of the data.For example, for a robot model, we need to know what the model we designed looks like, and where the many coordinate systems inside the model are during movement.
Another example is robotic arm motion planning and mobile robot autonomous navigation. We hope to be able to see the surrounding environment of the robot, the planned path, and of course sensor information, cameras, three-dimensional cameras, lidar, etc.Data is used for calculations, and the visualization effect is for people to see.
Therefore, data visualization can greatly improve development efficiency. Rviz2 is such a data visualization software in the robot development process. Robot models, sensor information, environmental information, etc., can all be handled here.
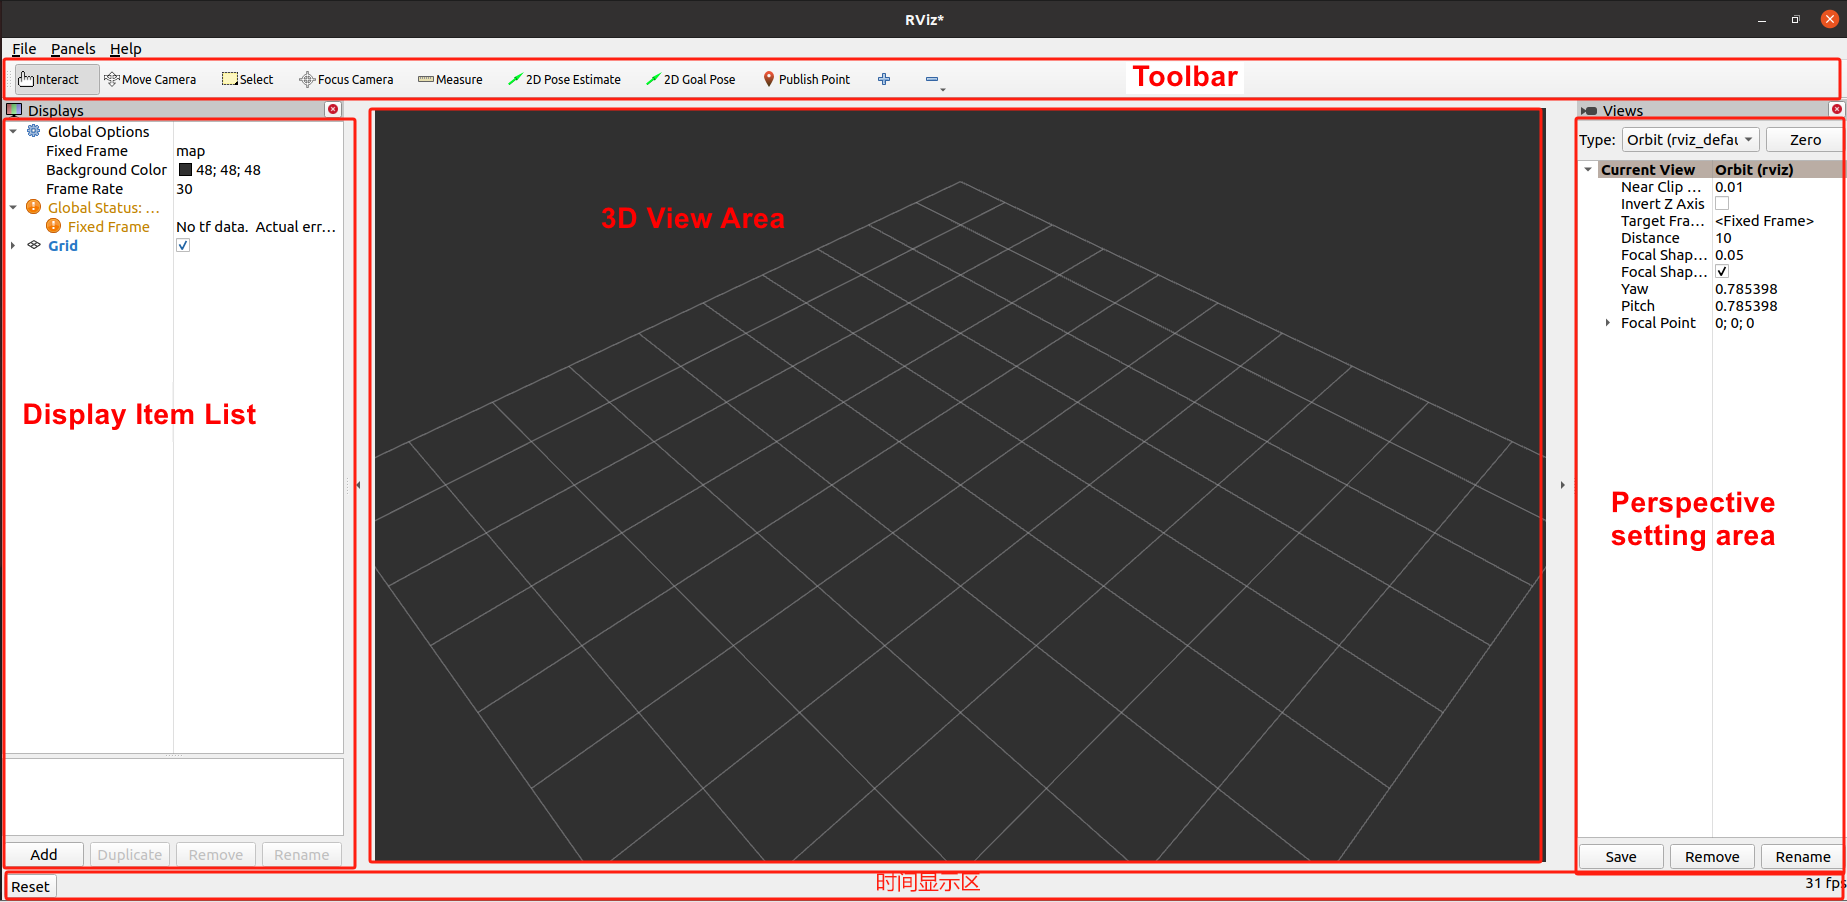
2. Rviz2 startup
Start a terminal and use the following command to start:
rviz2
If you are starting in docker, please make sure that the GUI display is turned on.
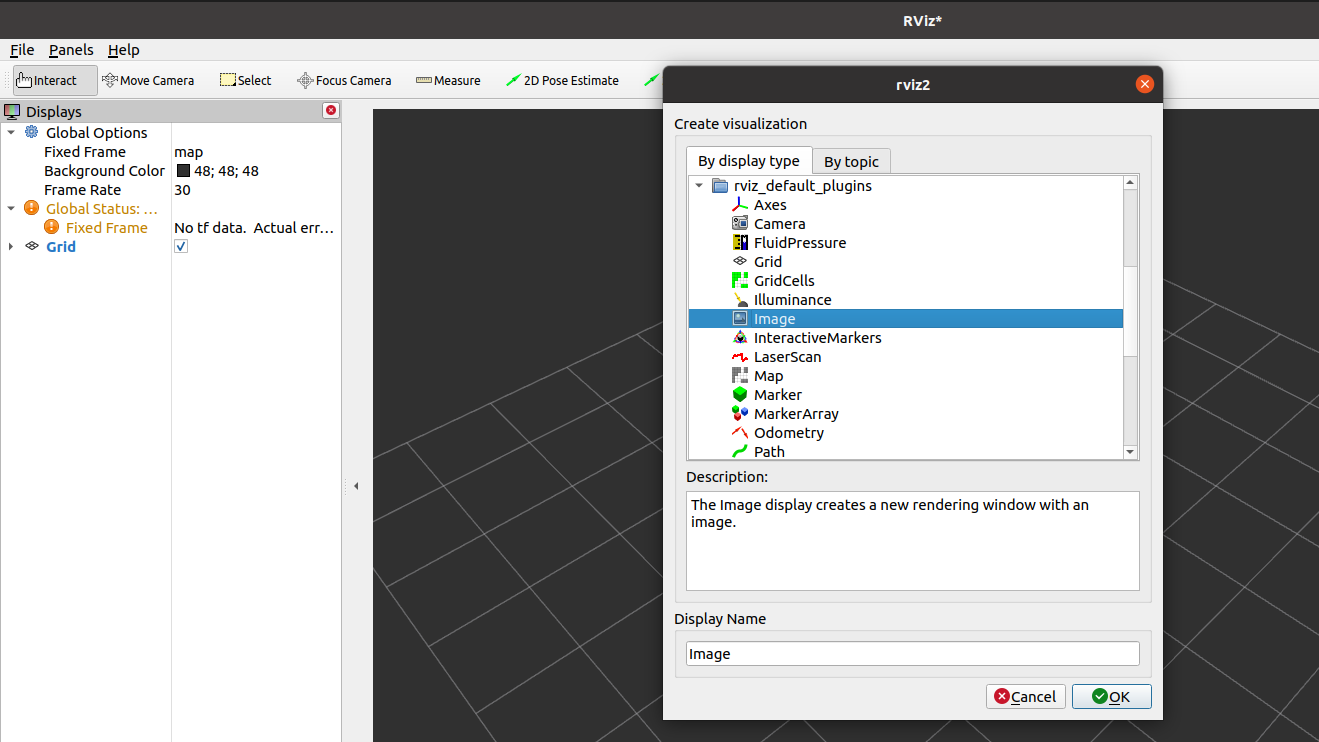
3. Image data visualization
First connect the camera, run the camera node, open rivz2, click "Add" in the Displays window on the left, find the Image display item, OK and confirm, you can add it to the display list.Then configure the image topic subscribed to the display item, and you can successfully see the robot's camera image.
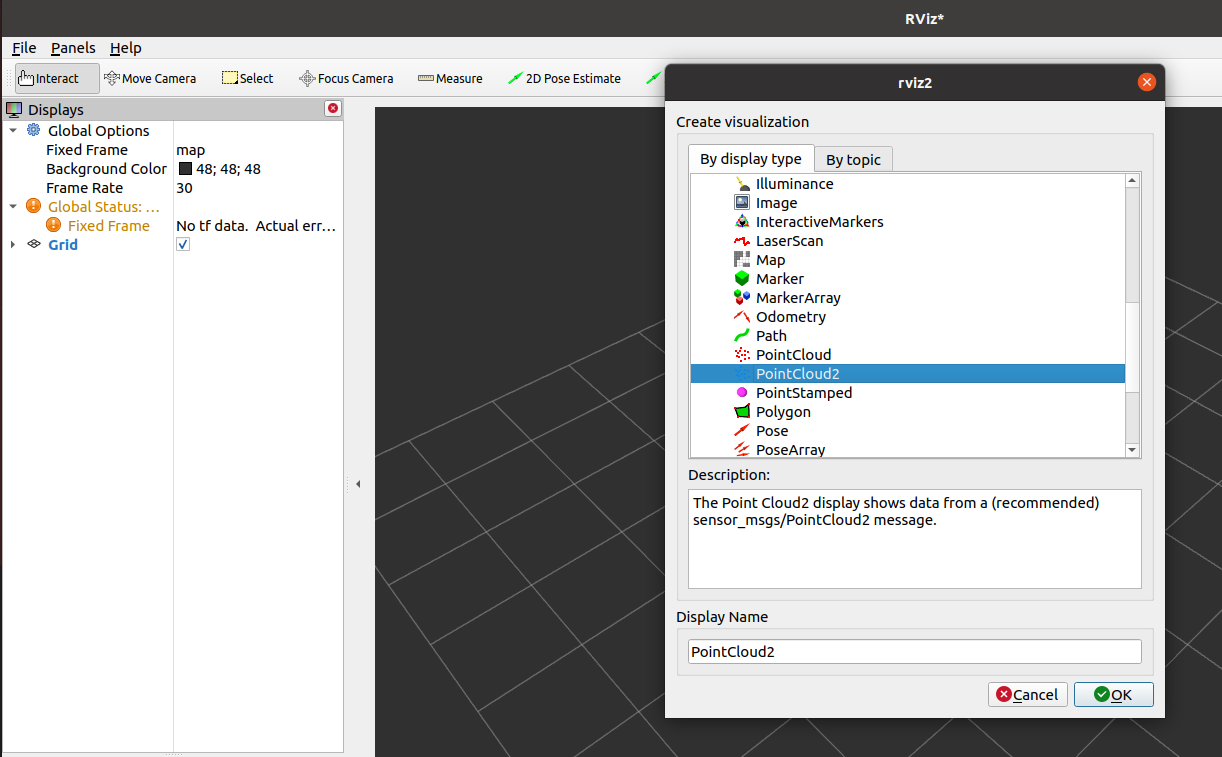
4. Point cloud data visualization
In the same process, first connect the camera, run the camera node, click Add, add PointCloud2, set the subscribed point cloud topic, and then you can see the point cloud data.
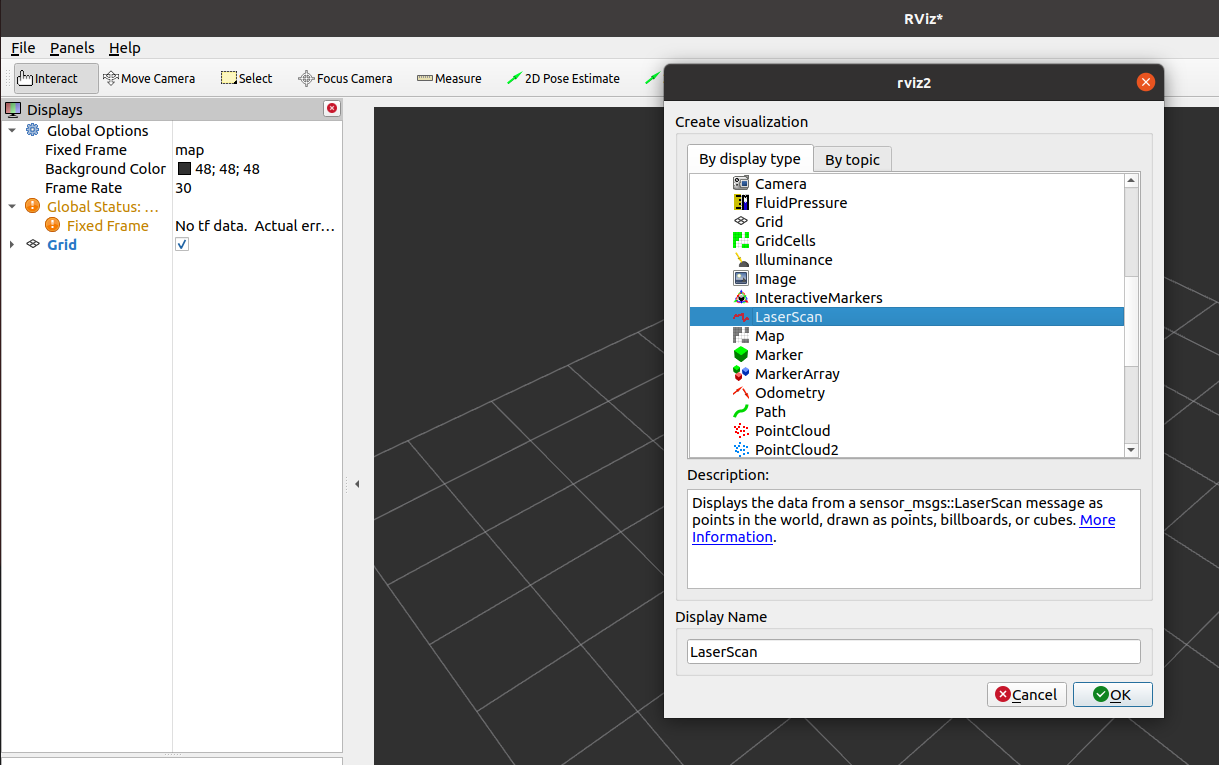
5. Lidar data visualization
First connect to Lidar, run the Lidar node, click Add, select Laserscan, and then configure the topic name of the subscription. At this time, you can see the laser point.
6. Other data visualization
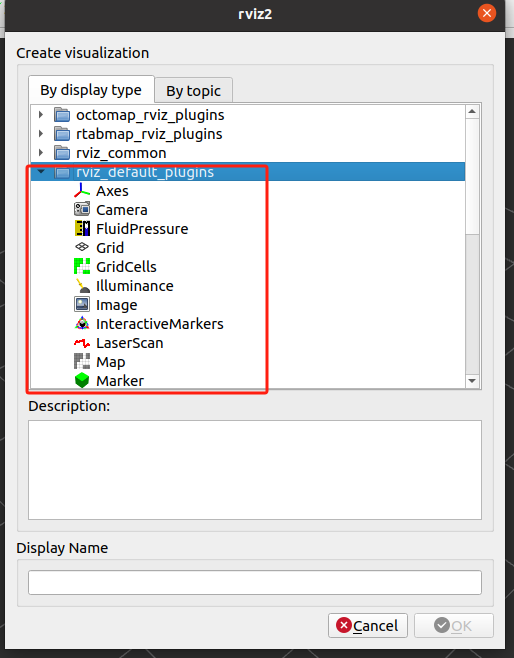
Many commonly used data visualization plug-ins are listed in rivz_default_plugins. You can try to use them one by one.