Welcome to MSPM0G3507 Development Board repository
05.Program simulation and debugging
Program simulation and debugging
Program simulation and debuggingSoftware configurationDebug operationDebug tool introductionCommon debugging operations
Keil is a simulation software with great potential. You can quickly solve the problems in code running and determine the location of the problem through debugging. You can check many hardware-related registers and observe the changes in the values of these registers to know whether the code is running normally. This can avoid frequent downloading of programs and extend the life of the microcontroller Flash.
This tutorial uses DAP-LINK for simulation. If you don’t have hardware equipment, you need to buy it yourself.
The basic simulation debugging operation is divided into two steps:
Software configuration
The configuration process is the same as using DAP-LINK to burn.
Debug operation
Click the debug icon to enter the debugging interface.

Debug tool introduction
From left to right

1: Reset
As the name suggests, reset means to start over again from the beginning. Its function is equivalent to pressing the reset button on the hardware, which is equivalent to a hard reset. After pressing the button, the code will be executed again from the beginning.
2: Execute to breakpoint
Press this button to quickly execute to the breakpoint. Sometimes you don’t need to watch how each step is executed. You just want to quickly execute to a certain place in the program to see the result. Pressing this button can satisfy your wish. Of course, the premise is that the breakpoint has been set at the viewing location.
3: Stop running
This button becomes valid only when the program is executed all the time, and it can stop the program and enter the single-step debugging state. Instantly stop the program.
4: Single-step debugging (enter function)
In simple terms, this button enters a function. Of course, if there is no function, it is equivalent to the execute button.
5: Step-by-step debugging (skip function)
When you encounter a function, you can use this button to step through the function without entering it. In short, it skips the function and does not execute it.
6: Jump out of debugging (jump out of function)
When you enter the single-step debugging of the function, sometimes you may not need to execute the rest of the function. Through this button, you can directly execute the rest of the function in one step and jump out of the function to the location where the function is called.
7: Execute to cursor
This button can quickly run the program to the cursor, which is similar to the function of the execute to breakpoint button.
8: Display the line of code being executed
The following is a menu added to the debug mode
9: Command display window
10: Disassembly window
This button can view the assembly code, which is very useful for analyzing the program.
11: Module Window
12: Register Window
13: Called Function Stack Window
This button can be used to display the Call Stack+Locals window, which displays the local variables and their values of the current function for easy viewing.
14: View (Variable) Window
MDK5 provides 2 observation windows (pull-down selection). When this button is pressed, a window showing variables pops up. Enter the variable or expression you want to observe to view its value. It is a very commonly used debugging window.
15: Memory Window
MDK5 provides 4 memory viewing windows. When the button is pressed, a memory viewing window pops up. You can enter the memory address you want to view in it, and then observe the changes in this piece of memory.
16: Serial UART Window
MDK5 provides 4 serial port printing windows. Press this button to pop up a window similar to the serial port debugging assistant interface to display the content printed from the serial port.
17: Logic Analyzer Window
There are 3 options under this icon. Generally, the first one, which is the logic analysis window, is used. Use the SETUP button to create some new IO ports, so you can observe the level changes of these IOs and display them in various forms, which is more intuitive.
18: Tracking window
19: System (peripheral IO, USART, TIM, etc.) window
This button can provide a viewing window for various peripheral registers (selected by pull-down). Select the corresponding peripheral to call up the relevant register table of the peripheral and display the values of these registers, so that you can easily check whether the settings are correct.
20: Toolbox window
Common debugging operations
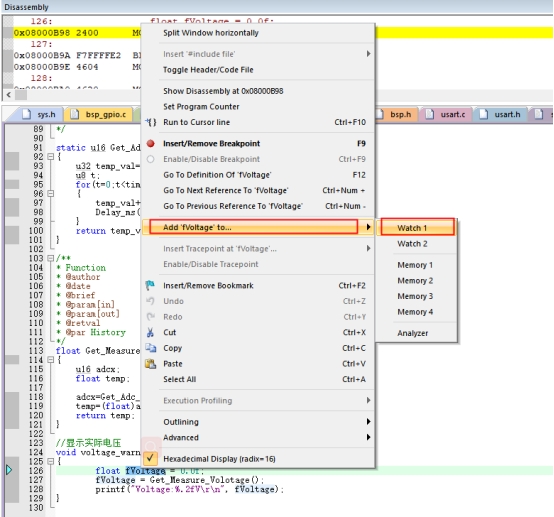
- Add an observation window
Add an observation window for the observed variable (position the cursor on the variable, right-click and select Add "start_flag to..."------>Watch1)
- Set breakpoints
After setting breakpoints, you can debug step by step and observe the program running results
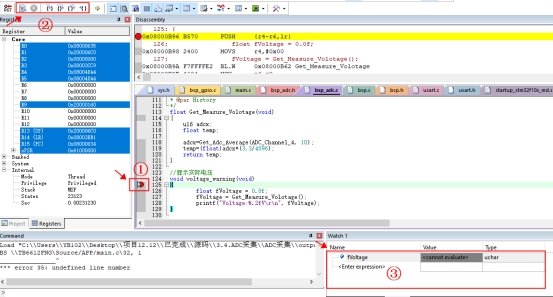
Generally, the program runs without errors, but the corresponding effect is not observed after downloading. You can set breakpoints from the beginning of the main function to see if the expected effect is achieved, execute to the corresponding function, and whether the changes in variables are consistent with expectations. For more debugging methods, you can learn from Baidu.