Welcome to MSPM0G3519 Development Board repository
5. Program Simulation and Debugging
Program Simulation and Debugging
Program Simulation and DebuggingSoftware ConfigurationDebug OperationsDebug Tools IntroductionCommon Debugging Operations
Keil, as a simulation software with great potential, can quickly solve code execution problems through debug, locate the position where problems occur, and view many hardware-related registers. By observing changes in these register values, you can determine if the code is running normally. This avoids frequent program downloads and extends the microcontroller Flash lifespan.
This tutorial uses DAP-LINK for simulation. If you do not have hardware, you need to purchase it yourself.
Keil5 basic simulation and debugging operations are divided into two steps:
Software Configuration
The configuration process is the same as using DAP-LINK for flashing.
Debug Operations
Click the debug icon to enter the debugging interface.

Debug Tools Introduction
From left to right

1: Reset
As the name suggests, reset means starting over from the beginning. Its function is equivalent to pressing the hardware reset button, essentially performing a hard reset. After pressing this button, the code will start executing from the beginning.
2: Run to Breakpoint
Press this button to quickly execute to the breakpoint. Sometimes you don't need to watch how each step executes - you just want to quickly execute to a certain point in the program to see the results. Pressing this button can fulfill your wish, of course, the prerequisite is that a breakpoint has been set at the location you want to view.
3: Stop Running
This button only becomes effective when the program is continuously executing. It can stop the program and enter single-step debugging mode. Instantly puts the program in a stopped state.
4: Single-Step Debugging (Step Into)
Simply put, this button is used to step into a function. Of course, if there is no function, it is equivalent to the step-over button.
5: Step Over (Skip Function)
When encountering a function, you can use this button to single-step through the function without entering the function for single-step execution. In short, skip the function without executing it.
6: Step Out (Exit Function)
This button is used when you are in function single-step debugging. Sometimes you may not need to execute the remaining part of the function. By pressing this button, you can directly execute the remaining part of the function in one step and exit the function back to where the function was called.
7: Run to Cursor
This button can quickly run the program to the cursor position, similar to the Run to Breakpoint button.
8: Show Currently Executing Code Line
The following are debugging mode added menus
9: Command Display Window
10: Disassembly Window
Through this button, you can view assembly code, which is very useful for analyzing programs.
11: Module Window
12: Register Window
13: Called Function Stack Window
Through this button, you can display the Call Stack+Locals window, showing local variables of the current function and their values for easy viewing.
14: Watch (Variables) Window
MDK5 provides 2 watch windows (dropdown selection). Pressing this button pops up a window for displaying variables. Enter the variable or expression you want to watch to view its value. This is a commonly used debugging window.
15: Memory Window
MDK5 provides 4 memory viewing windows. Press the button to pop up a memory viewing window. You can enter the memory address you want to view, then observe changes in this memory area.
16: Serial UART Window
MDK5 provides 4 serial port printing windows. Press this button to pop up a window similar to a serial debugging assistant interface, used to display content printed from the serial port.
17: Logic Analyzer Window
This icon has 3 options below. The first one is usually used, which is the logic analyzer window. Through the SETUP button, you can create some IO pins, so you can observe level changes on these IO pins and display them in various forms, which is quite intuitive.
18: Trace Window
19: System (Peripheral IO, USART, TIM, etc.) Window
This button can provide various peripheral register viewing windows (selected through dropdown). Select the corresponding peripheral to bring up the relevant register table for that peripheral and display the values of these registers for easy viewing to confirm if settings are correct.
20: Toolbox Window
Common Debugging Operations
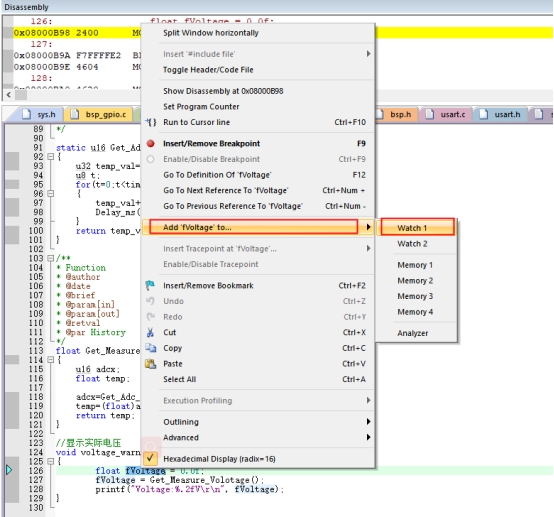
Add Watch Window
Add a watch window for the variable being observed (position the cursor on the variable, right-click and select Add "start_flag to..." ------>Watch1)
Set Breakpoint
After setting a breakpoint, you can single-step debug and observe the program execution result.
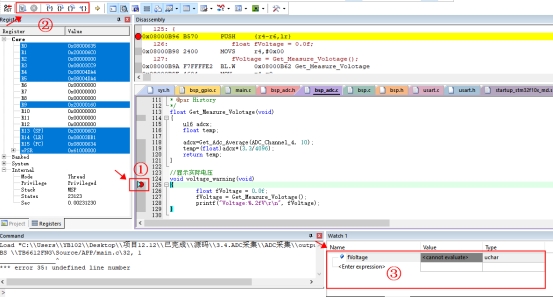
Generally, if the program runs without errors but the expected effect is not observed after downloading, you can set a breakpoint from the beginning of the main function to see if it executes as expected, and whether variable changes match expectations. For more debugging methods, you can search and learn online.