Welcome to Jetson ORIN NANO SUPER repository
当製品の日本語版マニュアル資料は、こちらからご取得ください。
6. Temperature and Humidity Dashboard
OpenClaw Temperature and Humidity Dashboard Tutorial
Before starting, please complete the [01-Hardware Configuration], [02-openclaw API-KEY Configuration], [03-openclaw Model Switching], [04-AI Voice Interaction Configuration], [05-Three Dialogue Solution Configuration Tests] under the
Prerequisitesdirectory. If you are currently only using TUI / whatsapp, you can skip04for now. This article assumes the basic environment has been prepared and only expands on the temperature and humidity dashboard project itself.
1. Tutorial Objectives
This article demonstrates OpenClaw's multi-peripheral coordination capability in desktop dashboard scenarios through the combination of "sensor + display + indication". After completing this tutorial, readers can:
Understand how to combine DHT, OLED, RGB, and servo into a temperature and humidity dashboard
Communicate with OpenClaw through three methods: whatsapp, TUI, and voice code
Complete four project scenarios: real-time readings, OLED indicator panel, RGB status light, servo pointer mapping
2. Hardware Preparation
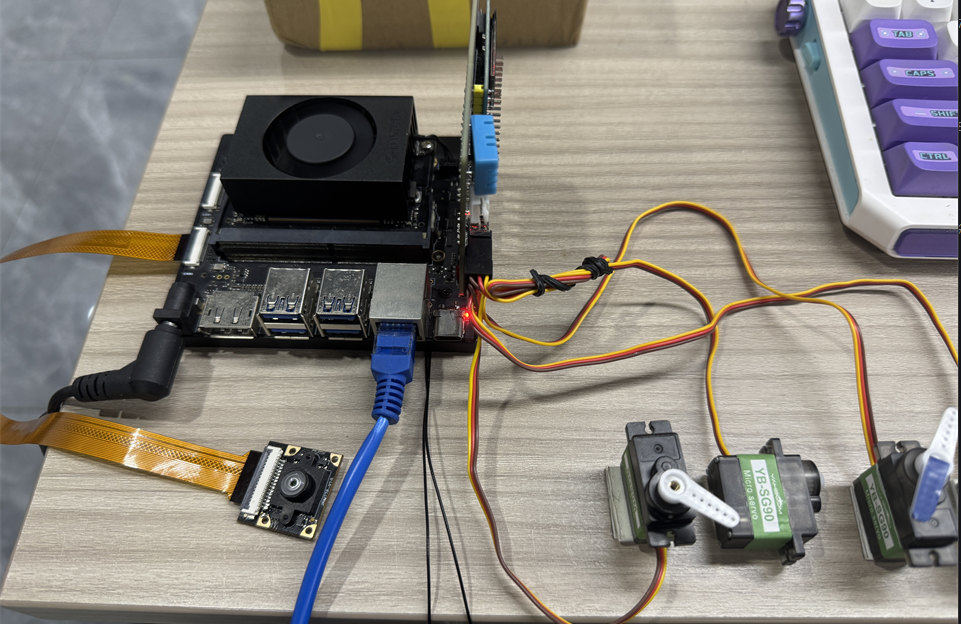
OpenClaw mainboard
DHT temperature and humidity sensor
OLED display
RGB light strip / RGB light bead module
[Optional] AI voice module + speakerWiring diagram
3. Software Preparation
Code entry points that will be used in the tutorial
Temperature and humidity reading command:
/home/jetson/hardware_hal_demo/dhtOLED control command:
/home/jetson/hardware_hal_demo/oledRGB control command:
/home/jetson/hardware_hal_demo/rgbServo control command:
/home/jetson/hardware_hal_demo/cli/servoVoice entry:
/home/jetson/voice_to_openclaw/src/main.py
This project is very close to the AI weather station, but the focus is different:
AI weather station emphasizes more on "broadcast" and "explanation"
Temperature and humidity dashboard emphasizes more on "display" and "status mapping"
4. Test Project Basic Capabilities
Before starting this project, please complete one openclaw tui basic dialogue self-check; if you haven't done it yet, see [05-Three Dialogue Solution Configuration Tests]. After passing, enter temperature and humidity dashboard specific testing.
It is recommended to first enter OpenClaw TUI:
openclaw tui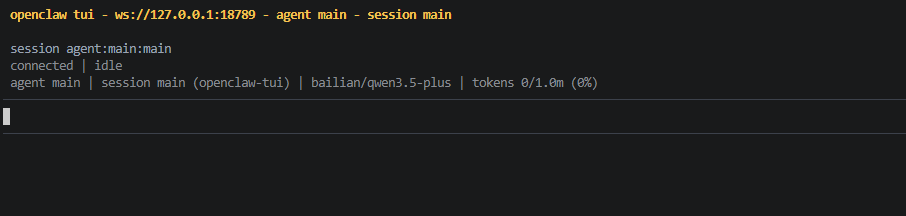
Then test the following types of commands:
Read current temperature and humidity
Display current temperature and humidity on OLED
If environment is normal, light green
Turn servo to 90 degrees
5. Three Solutions for Communicating with OpenClaw
| Solution | Suitable Scenarios | Advantages | Recommended Positioning |
|---|---|---|---|
| Remote status viewing, classroom demonstrations | Convenient for remote reading of current panel data | Demonstrate "remote monitoring panel" | |
| TUI | Local debugging, mapping verification | Easiest to troubleshoot reading and action relationships | First run through visualization chain |
| Voice code | Voice broadcast, desktop assistant | Closer to daily usage method | As complete demonstration solution |
If optional AI voice module + speaker are selected, whatsapp dialogue, tui, whatsapp dialogue need to broadcast OpenClaw's reply content. You can run the following program in terminal. AI voice module dialogue does not need to run repeatedly
Modify whether to enable broadcast parameter
xxxxxxxxxx/home/jetson/voice_to_openclaw/.env
xxxxxxxxxxENABLE_TTS=true #This parameter controls whether to broadcast. After modification and saving, run the following program in terminalTerminal input
xxxxxxxxxxcd ~/voice_to_openclawsource .venv/bin/activatepython -m src.openclaw_session_tts
5.1 whatsapp Solution
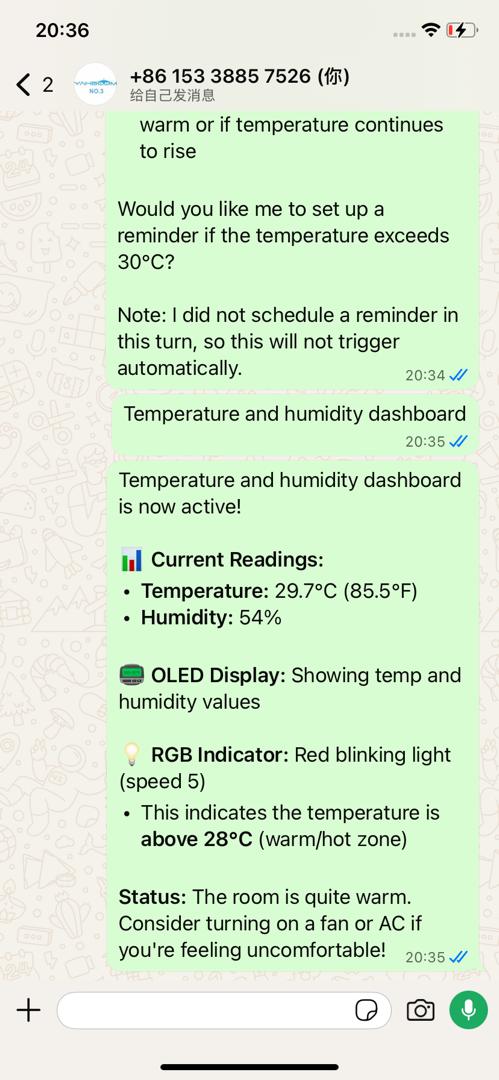
For whatsapp connection and robot creation steps, please directly refer to [05-Three Dialogue Solution Configuration Tests]. After creation, you can remotely view dashboard status in whatsapp, for example:
Temperature and humidity dashboard
5.2 TUI Solution
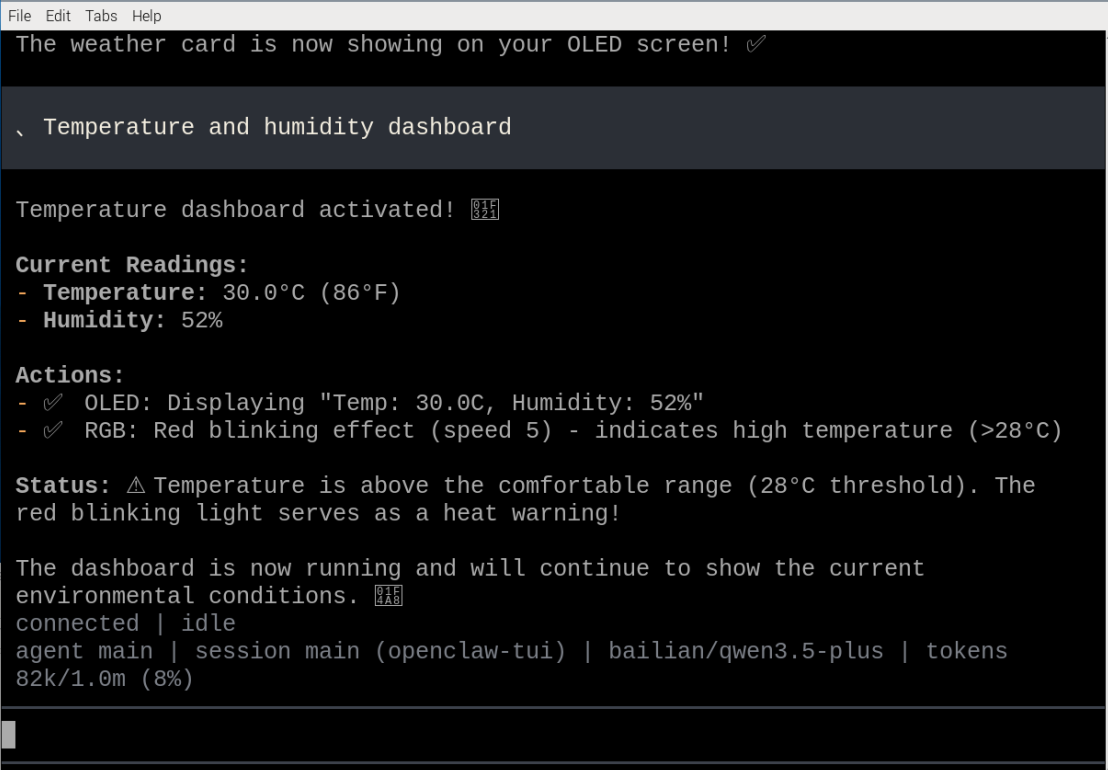
If you have completed the TUI self-check in Chapter 0, directly enter terminal text dialogue:
xxxxxxxxxxopenclaw tuiThen enter project-related commands, for example:
Temperature and humidity dashboard
5.3 Voice Code Solution
xxxxxxxxxxRequires optional AI voice interaction module + speaker
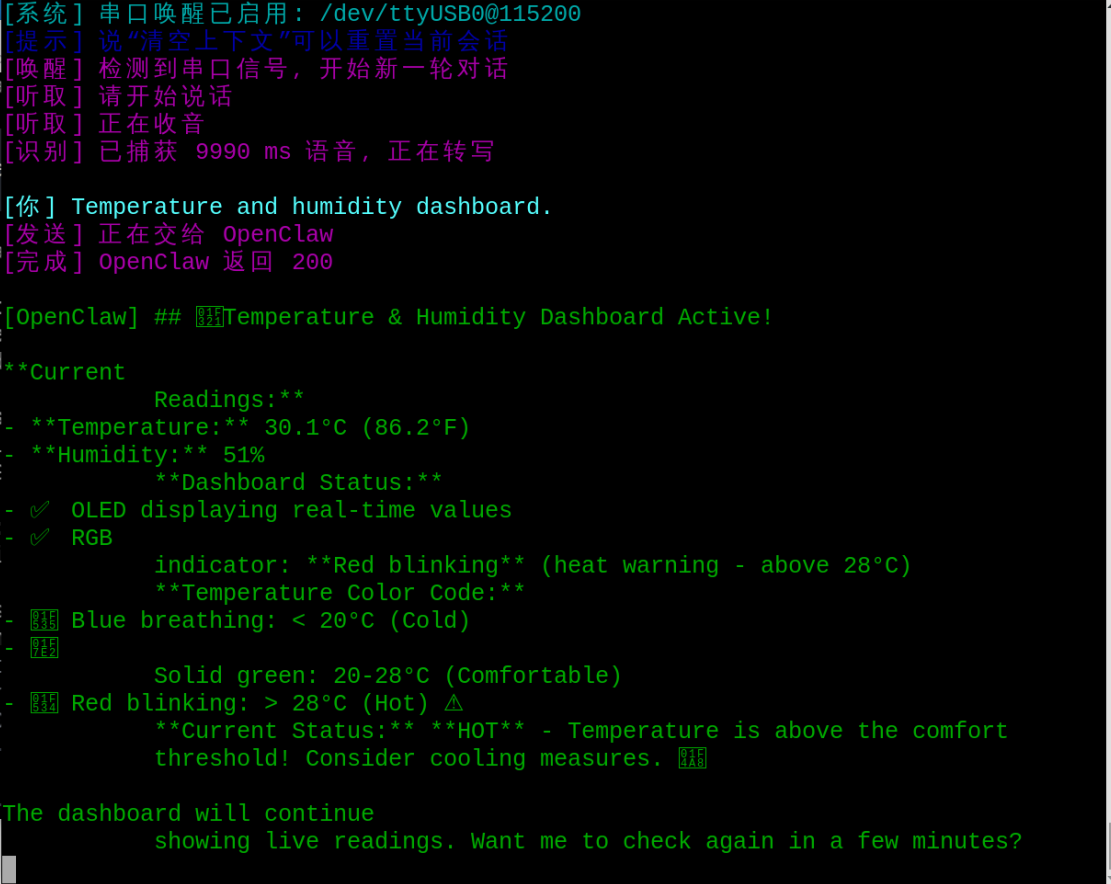
For voice module installation, environment configuration, and basic wake-up process, please directly refer to [04-AI Voice Interaction Configuration]. After waking up, you can directly say control content, for example:
Temperature and humidity dashboard
6. Project Implementation
Note: The following are all dialogue demonstrations using openclaw tui method. You can also choose whatsapp or voice method to complete.
6.1 Scenario One: Real-time Readings
Experimental Objective
Read current temperature and humidity, completing the basic data input for the dashboard.
Effect Description
OpenClaw will first obtain temperature and humidity readings. These values are the basis for subsequent OLED, RGB, and servo mapping.
Example Instructions
Read current temperature and humidity
What is the current temperature and humidity
Help me refresh the current readings
6.2 Scenario Two: OLED Indicator Panel
Experimental Objective
Display the current temperature and humidity results as concise OLED dashboard content.
Effect Description
Here it is suitable to use metrics or dht_oled method, combining Temp and Hum into a compact screen area, forming a small data panel.
Example Instructions
Display Temp and Hum on OLED
Make a simple temperature and humidity panel
Write current temperature and humidity to the screen
6.3 Scenario Three: RGB Status Light
Experimental Objective
Use RGB colors to express whether the current environment is normal, too hot, too cold, or too dry.
Effect Description
This step can make the dashboard more intuitive. For example, when normal, light green; when too hot, light yellow; when abnormal, light red; when too cold, light blue. You can see the status at a glance.
Example Instructions
If environment is normal, light green
If temperature is high, light yellow
If humidity is abnormal, light red
6.4 Scenario Four: Servo Pointer Mapping
Experimental Objective
Map temperature or humidity to servo angle, letting the servo point to a position like a dashboard pointer.
Effect Description
For example, map the temperature range to 0 to 180 degrees. The higher the current temperature, the more the servo pointer points to the right. This effect is very suitable for classroom demonstrations, because "numbers become physical actions" will be very intuitive.
Example Instructions
Use servo to represent current temperature like a pointer
Map current temperature to servo angle
Let the pointer point to current status