Welcome to Rider Pi Robot repository
1. Color Image Histogram
1. Color image histogram
1.1. Color image histogram
The color histogram refers to the color distribution in an image. It has nothing to do with the specific objects in the image. It is only used to indicate the color distribution in the image observed by the human eye, for example, how much red accounts for in a picture, how much green accounts for, etc.
We know that computer color displays use the principle of R, G, and B additive color mixing. By emitting three electron beams of different intensities, the red, green, and blue phosphorescent materials covered on the inside of the screen emit light to produce colors. In the RGB color space, any color light F can be added and mixed by different components of the three colors RGB. In other words, the color value of each pixel in the image can be represented by a ternary value (R, G, B), for example, (0, 0, 0) represents black, (0, 0, 255) represents blue, ... The size of each component ranges from 0 to 255.
So, we can know that a color image can be stacked by three channels of R, G, and B. You can imagine stacking three pieces of paper of the same size, and the image that the human eye sees from top to bottom is the original color image. Here, assuming that the image resolution is 320x240, then each channel is 320 long and 240 wide, the unit is pixel, and the total number of pixels is 3x320x240.
Method 1:
Use the pyplot sub-library of matplotlib to implement it, which provides a drawing framework similar to Matlab. Matplotlib is a very powerful and basic Python drawing package. The histogram is mainly called by the hist() function, which draws the histogram according to the data source and pixel level.
The form of the hist() function is as follows:
hist(data source, pixel level)
Among them, the parameters are:
Data source: must be a one-dimensional array, usually the image needs to be straightened through the ravel() function
Pixel level: generally 256, indicating [0, 255]
The ravel() function reduces a multidimensional array to a one-dimensional array, and its format is:
One-dimensional array = multidimensional array.ravel()
eg: plt.hist(img.ravel(), 256) #ravel() reduces two-dimensional to one-dimensional Grouping of 256 gray levels
Method 2:
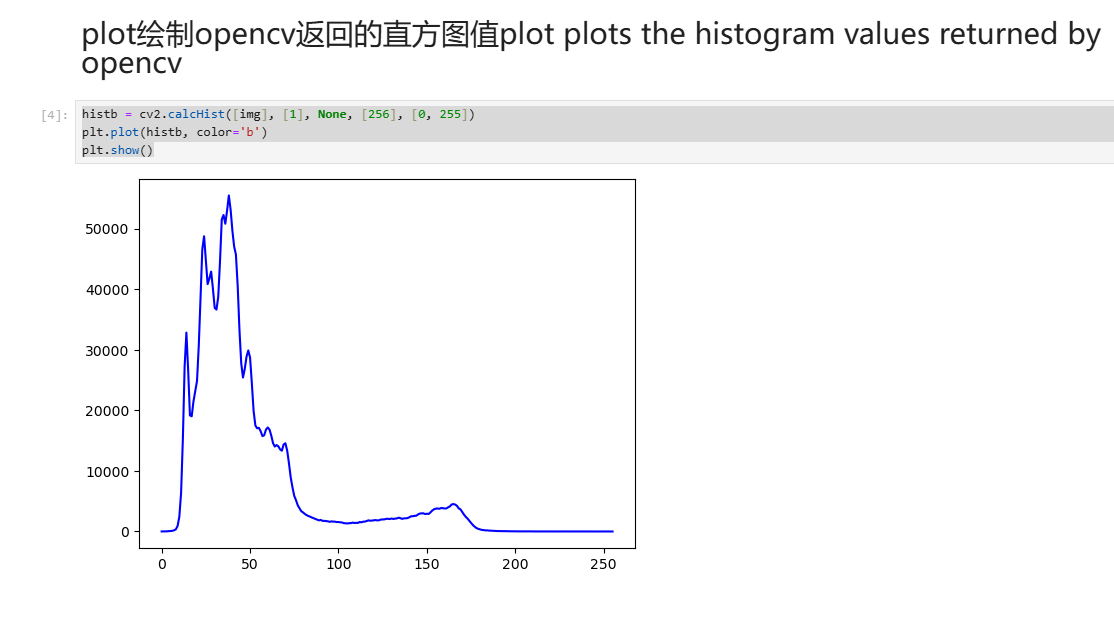
The function provided by OpenCV is:
cv2.calcHist(image,channels,mask,histSize,ranges[,hist[,accumulate]])
This function has 5 parameters:
image: input image, which should be enclosed in brackets [] when passed in
channels: the channel of the passed image. If it is a grayscale image, then it goes without saying that there is only one channel with a value of 0. If it is a color image (with 3 channels), then the value is 0, 1, 2, and one of them corresponds to each BGR channel. This value must also be passed in with [].
mask: mask image. If the whole image is counted, it is none. Mainly, if you want to count the histogram of part of the image, you have to construct the corresponding mask to calculate.
histSize: the number of gray levels, requires brackets, such as [256]
ranges: the range of pixel values, usually [0,256]. If some images are not 0-256, for example, if you transform back and forth and cause the pixel values to be negative or large, you need to adjust them.
1.2 Actual effect display
Source code path:
/home/pi/Rider-pi_class/4.Open Source CV/D.Image_Enhancement/01_Color_Image_Histogram.ipynb
ximport cv2import numpy as npimport matplotlib.pyplot as pltimg = cv2.imread('Road_test.jpg', 1)img = cv2.cvtColor(img, cv2.COLOR_BGR2RGB)plt.imshow(img)plt.show()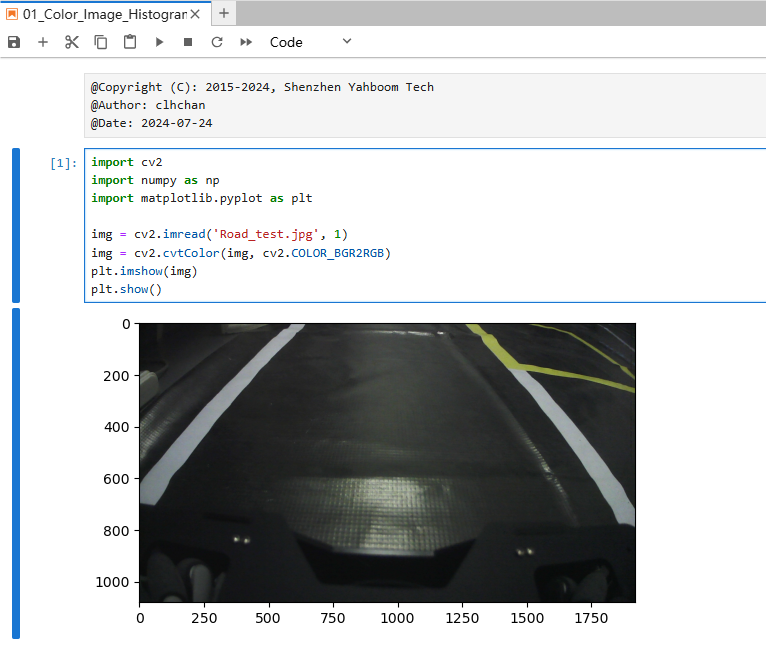
xxxxxxxxxxplt.hist(img.ravel(), 256) #ravel() 二维降一维 256灰度级的分组情况 2D to 1D Grouping of 256 gray levelsplt.show()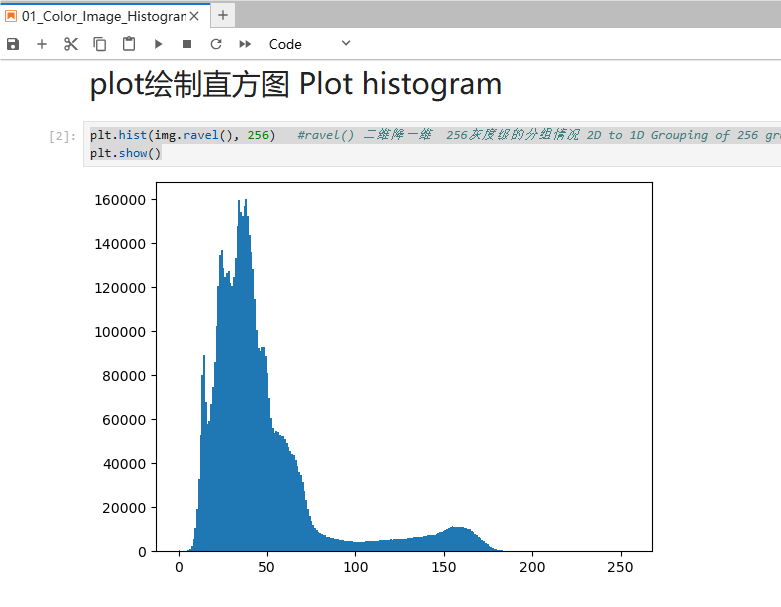
xxxxxxxxxxhistb = cv2.calcHist([img], [1], None, [256], [0, 255])plt.plot(histb, color='b')plt.show()