Welcome to ROSMASTER A1 repository
16. Line drawing
Line drawing
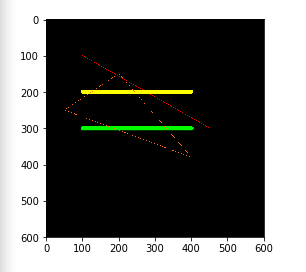
When using OpenCV to process images, we sometimes need to draw line segments, rectangles, etc. on the image. In OpenCV, we use the line(dst, pt1, pt2, color, thickness=None, lineType=None, shift=None) function to draw line segments.
Parameter Description:
dst: output image.
pt1, pt2: Required parameters. The coordinate points of the line segment, representing the starting point and the ending point respectively
color: Required parameter. Used to set the color of the line segment
thickness: optional parameter. Used to set the width of the line segment
lineType: Optional parameter. Used to set the type of line segment. Optional values include 8 (8 adjacent connected lines - default), 4 (4 adjacent connected lines), and cv2.LINE_AA for anti-aliasing.
Code path:
xxxxxxxxxxopencv/opencv_basic/03_Image processing and text drawing/04 Line segment drawing.ipynb
xxxxxxxxxximport cv2import numpy as npimport matplotlib.pyplot as pltnewImageInfo = (600, 600, 3)dst = np.zeros(newImageInfo,np.uint8)# line# Draw line segment 1 dst 2 begin 3 end 4 colorcv2.line(dst, (100,100), (450,300), (0,0,255))# 5 line wcv2.line(dst, (100,200), (400,200), (0,255,255), 10)# 6 line typecv2.line(dst, (100,300), (400,300), (0,255,0), 10, cv2.LINE_AA)cv2.line(dst, (200,150), (50,250), (25,100,255))cv2.line(dst, (50,250), (400,380), (25,100,255))cv2.line(dst, (400,380), (200,150), (25,100,255))# cv2.imshow('dst',dst)# cv2.waitKey(0)dst = cv2.cvtColor(dst, cv2.COLOR_BGR2RGB)plt.imshow(dst)plt.show()