Welcome to Raspbot V2 repository
当製品の日本語版マニュアル資料は、こちらからご取得ください。
3. Edge Detection
3. Edge Detection
3. Edge Detection3.1.OpenCV image edge detection3.1.1. The purpose of image edge detection3.1.2.Canny edge detection algorithm3.1.3. How do we implement it in OpenCV? It's very simple, divided into three steps3.2 Actual effect display
3.1.OpenCV image edge detection
3.1.1. The purpose of image edge detection
Significantly reduce the data size of the image while retaining the original image attributes. There are currently many algorithms for edge detection. Although the Canny algorithm is old, it can be said that it is a standard algorithm for edge detection and is still widely used in research.
3.1.2.Canny edge detection algorithm
Among currently commonly used edge detection methods, the Canny edge detection algorithm is one of the methods that is strictly defined and can provide good and reliable detection. Because it has the advantages of meeting the three criteria of edge detection and being simple to implement, it has become one of the most popular algorithms for edge detection.
The Canny edge detection algorithm can be divided into the following 5 steps:
(1). Use Gaussian filter to smooth the image and filter out noise
(2). Calculate the gradient intensity and direction of each pixel in the image
(3). Apply non-maximum suppression to eliminate spurious responses caused by edge detection
(4). Apply double-threshold detection to determine real and potential edges
(5). Finally complete edge detection by suppressing isolated weak edges.
3.1.3. How do we implement it in OpenCV? It's very simple, divided into three steps
(1). Image grayscale: gray=cv2.cvtColor(img,cv2.COLOR_BGR2GRAY)
(2). Gaussian filtering (noise reduction processing) image: GaussianBlur (src, ksize, sigmaX [, dst [, sigmaY [, borderType]]]) -> dst
Parameter meaning:
src: input image, usually a grayscale image
ksize: Gaussian kernel size
sigmaX: Gaussian kernel standard deviation in the X direction
sigmaY: Gaussian kernel standard deviation in Y direction
dst: processed image
(3). The Canny method is used to process the image: edges=cv2.Canny(image, threshold1, threshold2[, apertureSize[, L2gradient]])
Parameter meaning:
edges: calculated edge image
image: The calculated edge image, usually the image obtained after Gaussian processing
threshold1: the first threshold in the process
threshold2: the second threshold during processing
apertureSize: aperture size of Sobel operator
L2gradient: The flag for calculating the gradient magnitude of the image. The default value is False. If True, the more accurate L2 norm is used for the calculation (that is, the sum of the squares of the derivatives in both directions and then the square root), otherwise the L1 norm is used (the absolute values of the derivatives in the two directions are directly added).
3.2 Actual effect display
Source code path:
/home/pi/project_demo/06.Open_source_cv_fundamentals_course/C.Image_Processing_Text_Drawing/03_Edge_Detection1.ipynb
/home/pi/project_demo/06.Open_source_cv_fundamentals_course/C.Image_Processing_Text_Drawing/03_Edge_Detection2.ipynb
方法一:
ximport cv2import numpy as npimport randomimport matplotlib.pyplot as plt
img = cv2.imread('yahboom.jpg',1)imgInfo = img.shapeheight = imgInfo[0]width = imgInfo[1]#cv2.imshow('src',img)#canny 1 gray 2 高斯 3 canny canny 1 gray 2 gauss 3 cannygray = cv2.cvtColor(img,cv2.COLOR_BGR2GRAY)imgG = cv2.GaussianBlur(gray,(3,3),0)dst = cv2.Canny(img,50,50) #图片卷积——》th Image convolution——》th# cv2.imshow('dst',dst)# cv2.waitKey(0)xxxxxxxxxximg_bgr2rgb1 = cv2.cvtColor(img, cv2.COLOR_BGR2RGB)plt.imshow(img_bgr2rgb1)plt.show()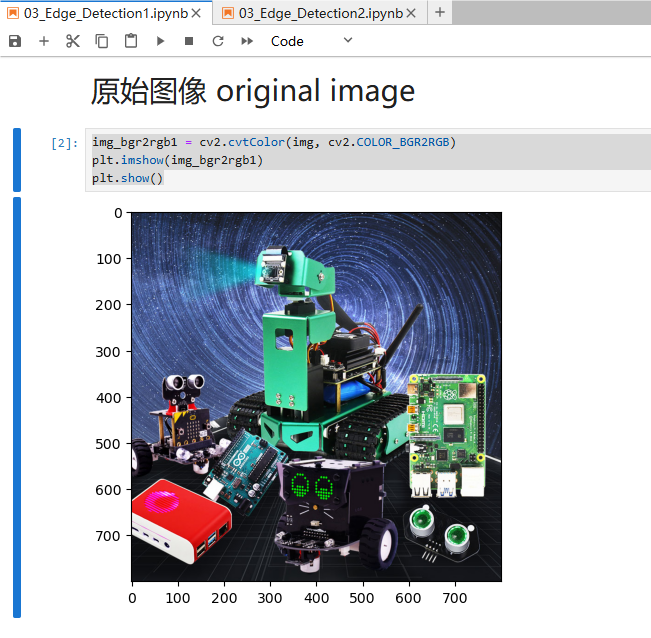
xxxxxxxxxximg_bgr2rgb1 = cv2.cvtColor(dst, cv2.COLOR_BGR2RGB)plt.imshow(img_bgr2rgb1)plt.show()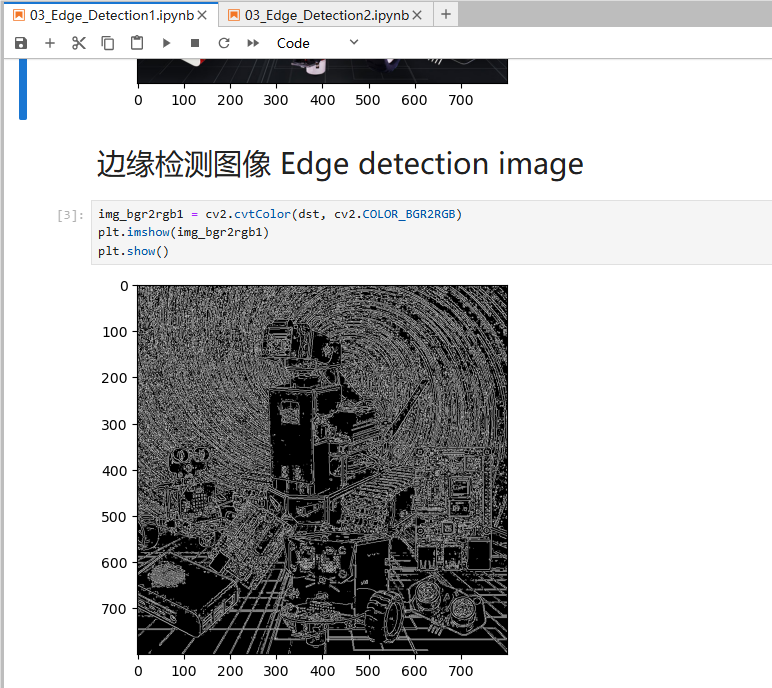
方法二:
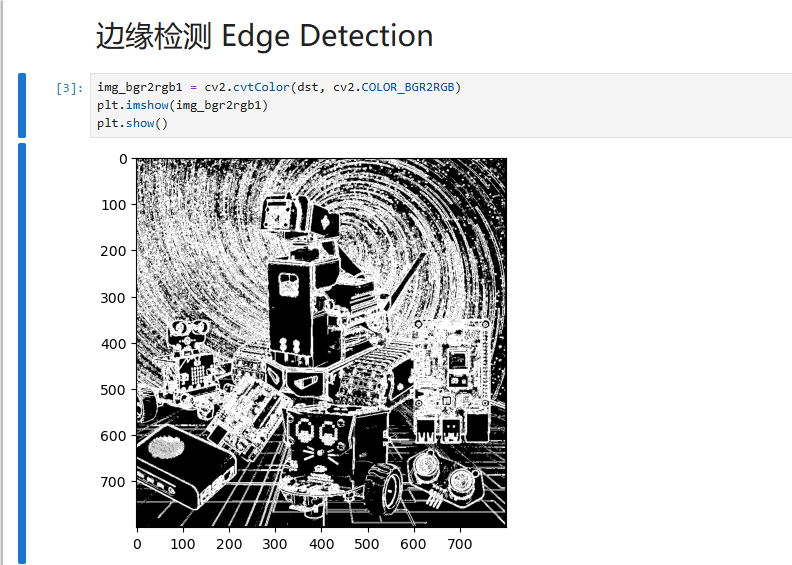
xxxxxxxxxximport cv2import numpy as npimport randomimport mathimg = cv2.imread('yahboom.jpg',1)imgInfo = img.shapeheight = imgInfo[0]width = imgInfo[1]# cv2.imshow('src',img)# sobel 1 算子模版 2 图片卷积 3 阈值判决 sobel 1 operator template 2 image convolution 3 threshold decision# [1 2 1 [ 1 0 -1# 0 0 0 2 0 -2# -1 -2 -1 ] 1 0 -1 ] # [1 2 3 4] [a b c d] a*1+b*2+c*3+d*4 = dst# sqrt(a*a+b*b) = f>thgray = cv2.cvtColor(img,cv2.COLOR_BGR2GRAY)dst = np.zeros((height,width,1),np.uint8)for i in range(0,height-2): for j in range(0,width-2): gy = gray[i,j]*1+gray[i,j+1]*2+gray[i,j+2]*1-gray[i+2,j]*1-gray[i+2,j+1]*2-gray[i+2,j+2]*1 gx = gray[i,j]+gray[i+1,j]*2+gray[i+2,j]-gray[i,j+2]-gray[i+1,j+2]*2-gray[i+2,j+2] grad = math.sqrt(gx*gx+gy*gy) if grad>50: dst[i,j] = 255 else: dst[i,j] = 0# cv2.imshow('dst',dst)# cv2.waitKey(0)xxxxxxxxxximport matplotlib.pyplot as plt
img_bgr2rgb1 = cv2.cvtColor(img, cv2.COLOR_BGR2RGB)plt.imshow(img_bgr2rgb1)plt.show()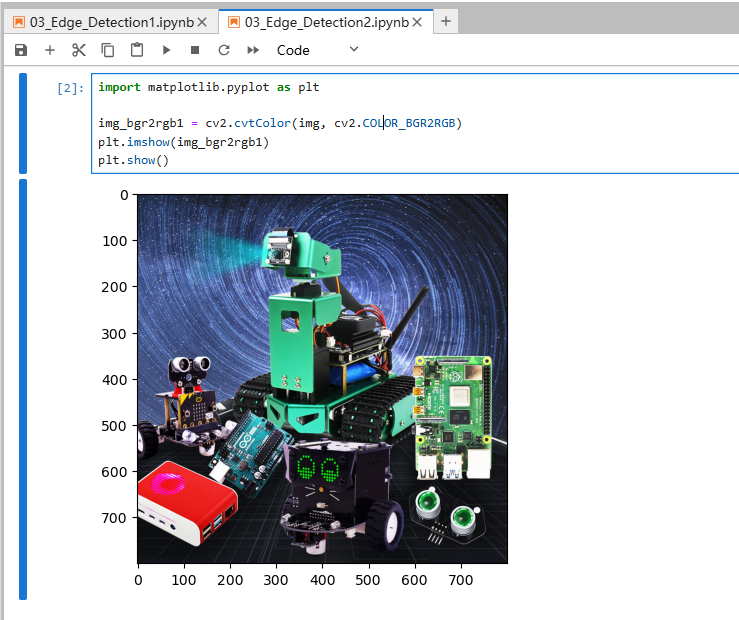
xxxxxxxxxximg_bgr2rgb1 = cv2.cvtColor(dst, cv2.COLOR_BGR2RGB)plt.imshow(img_bgr2rgb1)plt.show()