Welcome to Raspbot V2 repository
当製品の日本語版マニュアル資料は、こちらからご取得ください。
4. Line drawing
4. Line drawing
4.1.OpenCV line drawing
When using OpenCV to process images, we sometimes need to draw line segments, rectangles, etc. on the image. In OpenCV, use the
cv2.line(dst,pt1,pt2,color,thickness=None,lineType=None,shift=None)function to draw line segments.
Parameter meaning:
dst: output image.
pt1,pt2: required parameters. The coordinate points of the line segment, indicating the starting point and the end point respectively
color: required parameter. Used to set the color of the line segment
thickness: optional parameter. Used to set the width of the line segment
lineType: optional parameter. Used to set the type of line segment, optional 8 (8 adjacent connecting lines - default), 4 (4 adjacent connecting lines) and cv2.LINE_AA for anti-aliasing
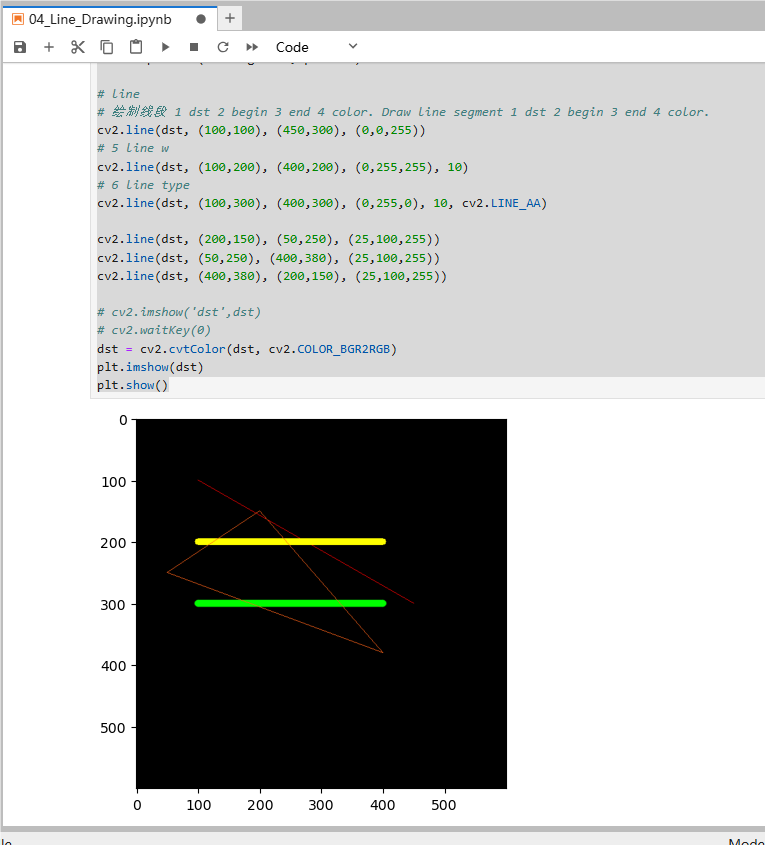
4.2. Actual effect display
Source code path:
/home/pi/project_demo/06.Open_source_cv_fundamentals_course/C.Image_Processing_Text_Drawing/04_Line_Drawing.ipynb
ximport cv2import numpy as npimport matplotlib.pyplot as plt
newImageInfo = (600, 600, 3)dst = np.zeros(newImageInfo,np.uint8)
# line# 绘制线段 1 dst 2 begin 3 end 4 color. Draw line segment 1 dst 2 begin 3 end 4 color.cv2.line(dst, (100,100), (450,300), (0,0,255))# 5 line wcv2.line(dst, (100,200), (400,200), (0,255,255), 10)# 6 line typecv2.line(dst, (100,300), (400,300), (0,255,0), 10, cv2.LINE_AA)
cv2.line(dst, (200,150), (50,250), (25,100,255))cv2.line(dst, (50,250), (400,380), (25,100,255))cv2.line(dst, (400,380), (200,150), (25,100,255))
# cv2.imshow('dst',dst)# cv2.waitKey(0)dst = cv2.cvtColor(dst, cv2.COLOR_BGR2RGB)plt.imshow(dst)plt.show()