Welcome to DOGZILLA-Lite repository
1. Image scaling
1. Image scaling
1. Image scaling1.1. OpenCV image scaling1.2. Actual effect display1.3.matplotlib: Python's 2D plotting library.
1.1. OpenCV image scaling
cv2.resize(InputArray src, OutputArray dst, Size, fx, fy, interpolation)
Parameter meaning:
InputArray src: input image
OutputArray ds: output image
Size: output image size
fx, fy: scaling coefficients along the x-axis and y-axis
interpolation: interpolation method, you can choose INTER_NEAREST (nearest neighbor interpolation), INTER_LINEAR (bilinear interpolation (default setting)), INTER_AREA (resample using pixel area relationship), INTER_CUBIC (bicubic interpolation of 4x4 pixel neighborhood), INTER_LANCZOS4 (Lanczos interpolation of 8x8 pixel neighborhood)
Note:
- The output size format is (width, height)
- The default interpolation method is: bilinear interpolation
1.2. Actual effect display
Code path:
/home/pi/DOGZILLA_Lite_class/4.Open Source CV/B.Geometric_Transformations/01_Image_Scaling.ipynb
ximport cv2import matplotlib.pyplot as plt # Python 2D drawing library# Read the original imageimg = cv2.imread('yahboom.jpg')# Print the image sizeprint(img.shape)# Assign the image height and width to x, y respectivelyx, y = img.shape[0:2]# Display the original image#cv.imshow('OriginalPicture', img)# Scale to half of the original size, output size format is (width, height)img_test1 = cv2.resize(img, (int(y / 2), int(x / 2)))# cv2.imshow('resize0', img_test1)# cv2.waitKey()# Nearest neighbor interpolation method scaling# Scale to one-fourth of the original sizeimg_test2 = cv2.resize(img, (0, 0), fx=0.25, fy=0.25, interpolation=cv2.INTER_NEAREST) # cv.imshow('resize1', img_test2) #cv.waitKey() #cv.destroyAllWindows() img = cv2.cvtColor(img, cv2.COLOR_BGR2RGB) dst1 = cv2.cvtColor(img_test1, cv2.COLOR_BGR2RGB)dst2 = cv2.cvtColor(img_test2, cv2.COLOR_BGR2RGB) # show original imageplt.imshow(img) plt.show()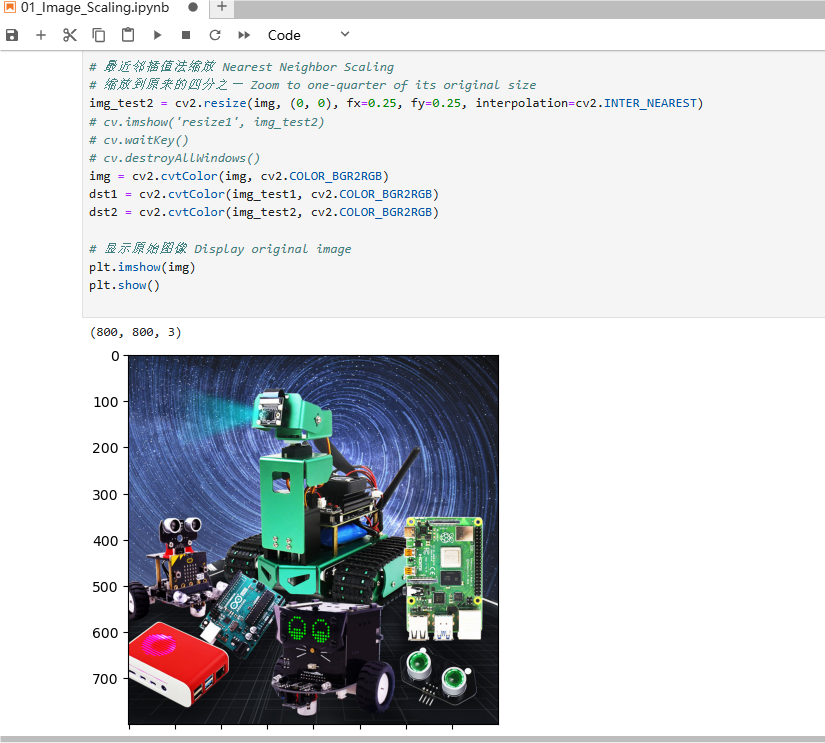
xxxxxxxxxx# Display zoom 1/2plt.imshow(dst1)plt.show()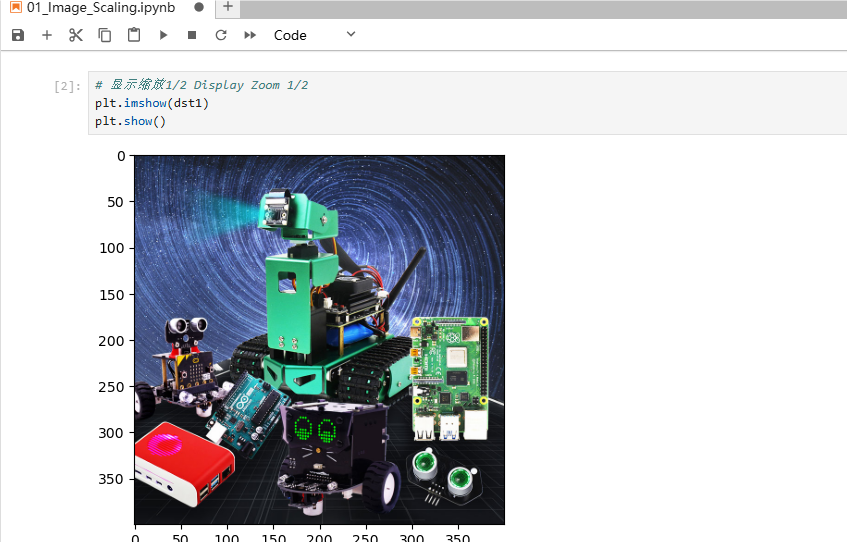
xxxxxxxxxx# Display zoom 1/4 neighbor interpolation method zoomplt.imshow(dst2)plt.show()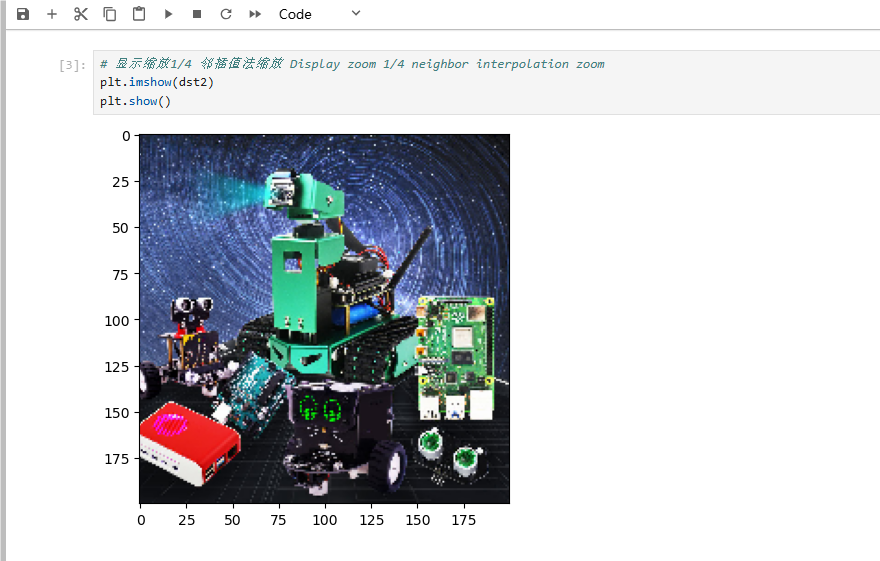
1.3.matplotlib: Python's 2D plotting library.
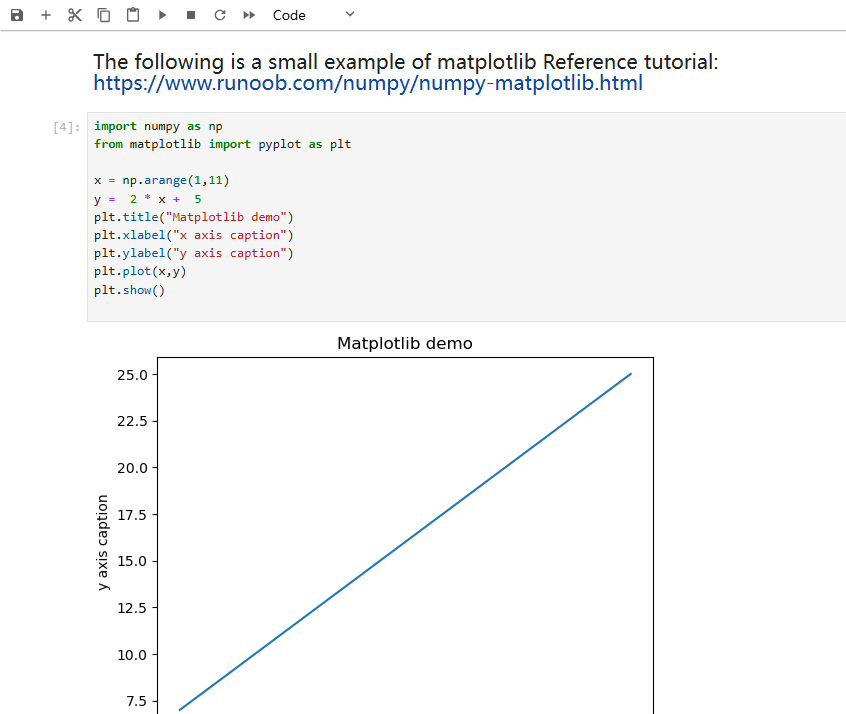
The following is a small example of matplotlib
Reference tutorial:https://www.runoob.com/numpy/numpy-matplotlib.html
xxxxxxxxxximport numpy as np from matplotlib import pyplot as plt x = np.arange(1,11)y = 2 * x + 5 plt.title("Matplotlib demo") plt.xlabel("x axis caption") plt.ylabel("y axis caption") plt.plot(x,y) plt.show()