Welcome to K230 Vision Module repository
19.Image Color Histogram
Image Color Histogram
Image Color HistogramExample ResultsPrinciple ExplanationWhat is an Image Histogram?Code OverviewImporting ModulesSetting the Image SizeInitialize the camera (RGB888 format)Initialize the display moduleInitialize the media manager and start the cameraImage Processing and Histogram CalculationResource ReleaseParameter Tuning Notes
Example Results
Run this section's example code [Source Code/06.cv_lite/19.rgb888_calc_histogram.py]
In this section, we will use the cv_lite extension module to implement image histogram calculation for RGB888 format on an embedded device.
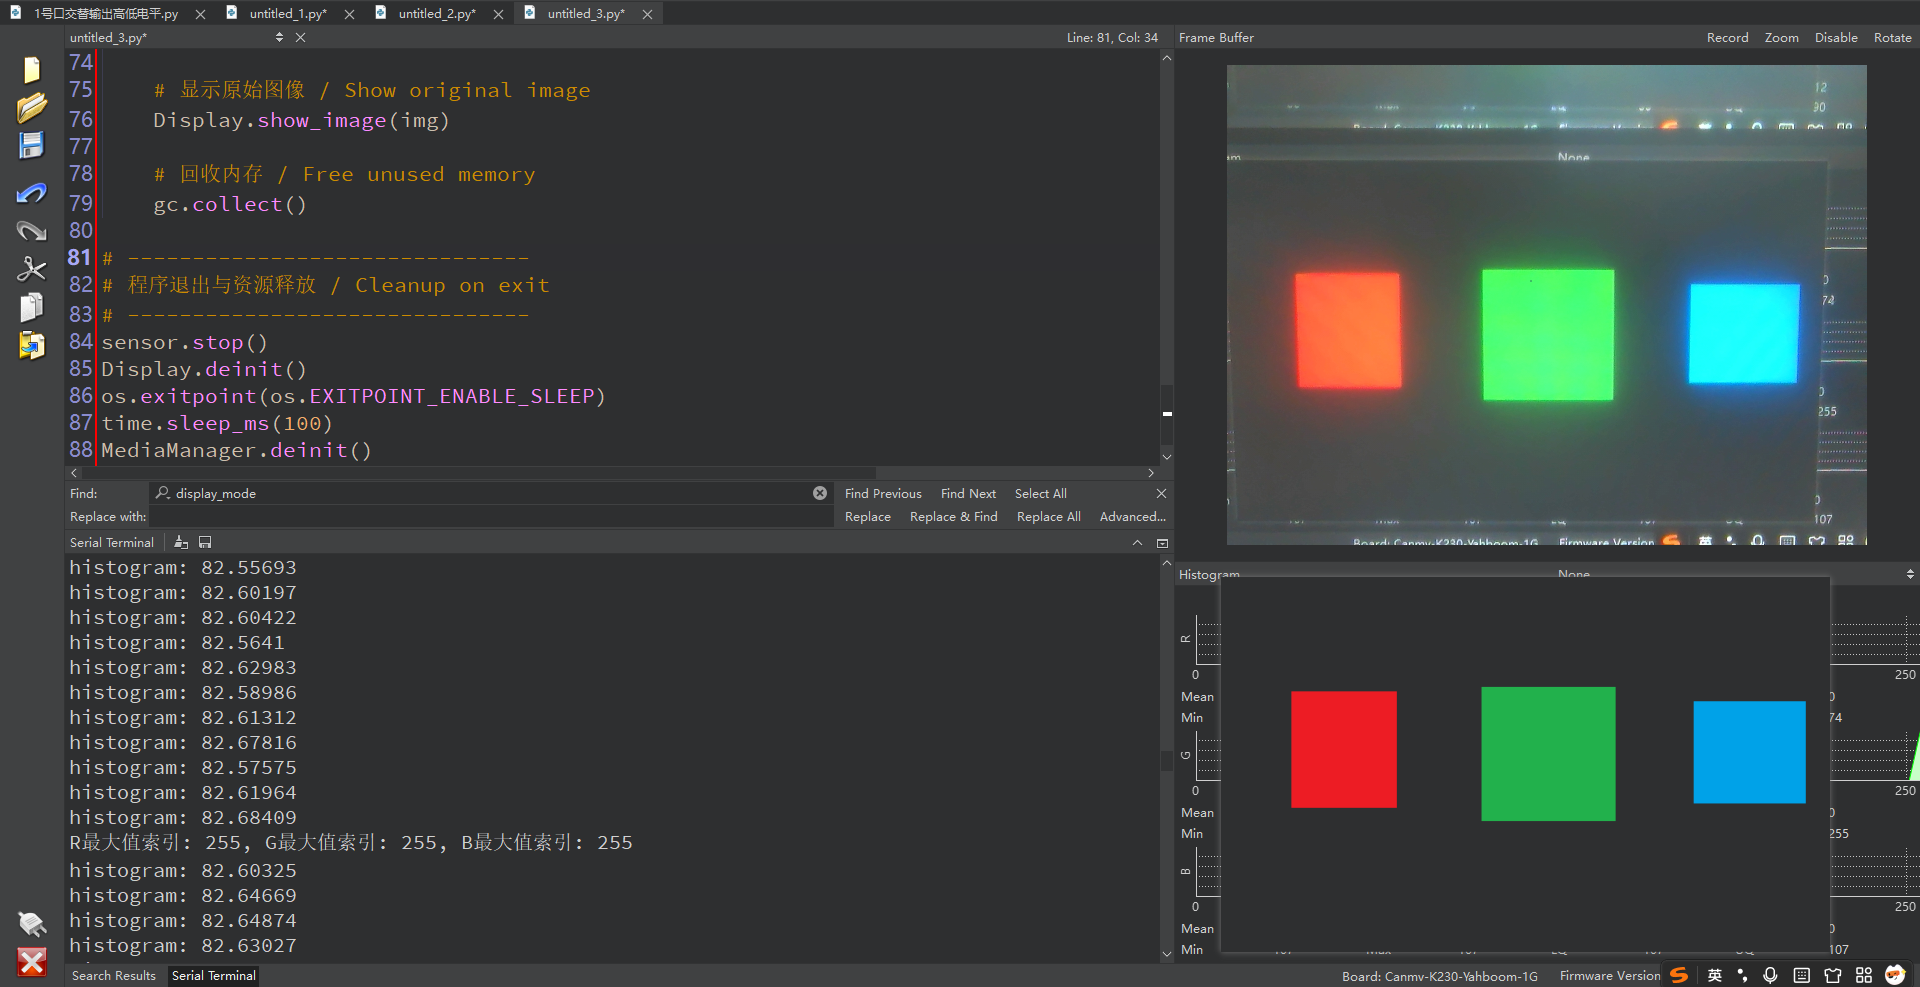
Principle Explanation
What is an Image Histogram?
An image histogram is a statistical tool used to represent the intensity distribution of image pixels. It describes the brightness, contrast, and color distribution of an image by counting the frequency of occurrence of each pixel value in the image. For color images such as RGB888, histograms are typically calculated separately for each color channel (red, green, and blue).
Basic concepts:
- Pixel value range: For 8-bit images, pixel values range from 0 (black) to 255 (white).
- Histogram representation: An array or chart where the x-axis represents the pixel value (0~255) and the y-axis represents the frequency of occurrence of the pixel value.
- For RGB888 images, the histogram is a 3-channel array (256 bins per channel) that counts the pixel distribution of the R, G, and B channels respectively.
Calculation process:
- Traverse the image pixels and count the number of each pixel value in each channel.
- The result is an array of shape 3x256 (for example, hist[0] is the B channel, hist[1] is the G channel, and hist[2] is the R channel).
Application:
- Image characteristics analysis: Helps evaluate the brightness of the image (histogram leaning to the left indicates dark, and leaning to the right indicates bright) and contrast (uniform distribution indicates high contrast).
- Image enhancement: Perform histogram equalization based on the histogram to improve image quality.
- In this code: After calculating the histogram, the maximum index of each channel (i.e., the bin with the highest pixel value frequency) is extracted to monitor the image's color distribution or abnormalities.
Histograms are a fundamental tool in image processing and are often used in preprocessing stages such as automatic exposure adjustment or object detection.
Code Overview
Importing Modules
import time, os, sys, gcfrom machine import Pinfrom media.sensor import * # Camera interfacefrom media.display import * # Display interfacefrom media.media import * # Media managerimport _threadimport cv_lite # cv_lite extension module, including the histogram function / C extension module for image processingimport ulab.numpy as np # ulab array module / NumPy-like ndarray for MicroPythonSetting the Image Size
xxxxxxxxxximage_shape = [480, 640] # Height x Width / Height x WidthDefine the image resolution to 480x640 (height x width). The camera and display modules will be initialized based on this size later.
Initialize the camera (RGB888 format)
xxxxxxxxxxsensor = Sensor(id=2, width=1280, height=960, fps=90)sensor.reset()sensor.set_framesize(width=image_shape[1], height=image_shape[0])sensor.set_pixformat(Sensor.RGB888) # Set pixel format to RGB888- Initialize the camera, set the resolution to 1280x960 and the frame rate to 90 FPS.
- Resize the output frame to 640x480 and set it to RGB888 format (three-channel color image, suitable for histogram calculation of color images).
Initialize the display module
xxxxxxxxxxDisplay.init(Display.ST7701, width=image_shape[1], height=image_shape[0], to_ide=True, quality=100)Initialize the display module, using the ST7701 driver chip, with a resolution consistent with the image size. to_ide=True indicates that the image will be simultaneously transmitted to the IDE for virtual display, and quality=100 sets the image transmission quality to the highest.
Initialize the media manager and start the camera
xxxxxxxxxxMediaManager.init()sensor.run()Initialize the media resource manager and start the camera to capture the image stream.
Image Processing and Histogram Calculation
xclock = time.clock()count = 0while True: count += 1 clock.tick() # Record the start time of the current frame # Capture a frame img = sensor.snapshot() img_np = img.to_numpy_ref() # Get an RGB888 image reference (HWC) # Calculate the RGB histogram using cv_lite (returns a 3x256 array) # Calculate RGB888 histogram using cv_lite (3x256 array) hist = cv_lite.rgb888_calc_histogram(image_shape, img_np) # Print the maximum bin index every 30 frames if count == 30: r_hist = hist[2] # R channel / Red channel g_hist = hist[1] # G channel / Green channel b_hist = hist[0] # B channel / Blue channel r_max = int(np.argmax(r_hist)) # R maximum index / Max index of red channel g_max = int(np.argmax(g_hist)) # G maximum index / Max index of green channel b_max = int(np.argmax(b_hist)) # B maximum index / Max index of blue channel print(f"R maximum index: {r_max}, G maximum index: {g_max}, B maximum index: {b_max}") count = 0 # Print current frame rate / Print FPS print("histogram:", clock.fps()) # Show original image / Show original image Display.show_image(img) # Reclaim memory / Free unused memory gc.collect()- Image Capture: Acquire an image frame using
sensor.snapshot()and convert it to a NumPy array reference usingto_numpy_ref(). - Histogram Calculation: Call
cv_lite.rgb888_calc_histogram()to calculate the RGB histogram of the image, returning a 3x256 array (256 bins per channel). - Data Analysis: Every 30 frames, use
np.argmax()to find the maximum index (i.e., the pixel value with the highest frequency) of each channel's histogram and print it out. - Display and Output: Display the original image, print the current frame rate, and perform garbage collection to manage memory.
Resource Release
xxxxxxxxxxsensor.stop()Display.deinit()os.exitpoint(os.EXITPOINT_ENABLE_SLEEP)time.sleep_ms(100)MediaManager.deinit()Parameter Tuning Notes
There are no explicitly tunable parameters (such as thresholds or kernel sizes) in this code. If performance needs to be optimized, you can adjust the counter (such as the interval of count == 30) in the main loop to control the printing frequency, but this does not directly affect the histogram calculation.