Welcome to Jetson Orin NANO Developer Kit repository
17.ROS2 rviz2 use
17. Using ROS 2 Rviz2
1. Introduction to Rviz2
During robot development, if we analyze the various functions only at the data level, it is difficult to quickly understand the effect of the data. Take the robot model as an example: we need to know what the model we designed looks like, and where the many coordinate frames inside the model are located during motion.
Another example is robotic arm motion planning and autonomous navigation of mobile robots. We want to see the environment around the robot, the planned path, and of course sensor information such as cameras, 3D cameras, and LiDAR. Data is used for computation, while visualization is what people actually look at.
Therefore, data visualization can greatly improve development efficiency. Rviz2 is exactly such a data visualization software for robot development: robot models, sensor information, environment information, and more can all be handled here.
2. Preparation
First, load the ROS 2 Jazzy environment in the terminal where the simulation will be started:
source /opt/ros/jazzy/setup.bashIf you have a physical robot, you can start rviz on the robot's main control terminal to practice the content of this lesson. If you do not have a physical robot, you can launch a TurtleBot3 simulated robot through Gazebo simulation to simulate topics such as LiDAR and camera, which facilitates the following data visualization.
Note: The following installation steps are optional. If you have a physical robot, you can directly use the radar information of the real robot after setting up multi-machine communication; you can choose to use the real robot's radar or a virtual simulated robot. The following content is intended for users without a physical robot.
This lesson takes a simulated robot as an example to teach the visualization functions of rviz2. Whether it is a real robot or a simulated robot, the operation flow of rviz2 is the same.
Install the TurtleBot3 simulator package
xxxxxxxxxxsudo apt install ros-${ROS_DISTRO}-turtlebot3*Install the ROS and Gazebo bridge tool
xxxxxxxxxxsudo apt install ros-${ROS_DISTRO}-ros-gzSet the TurtleBot3 robot type environment variable
xxxxxxxxxxexport TURTLEBOT3_MODEL=waffleTURTLEBOT3_MODEL must be valid in the same terminal where the simulation is started. You can first run echo $TURTLEBOT3_MODEL to confirm that it returns waffle; otherwise the launch file will report 'TURTLEBOT3_MODEL'.
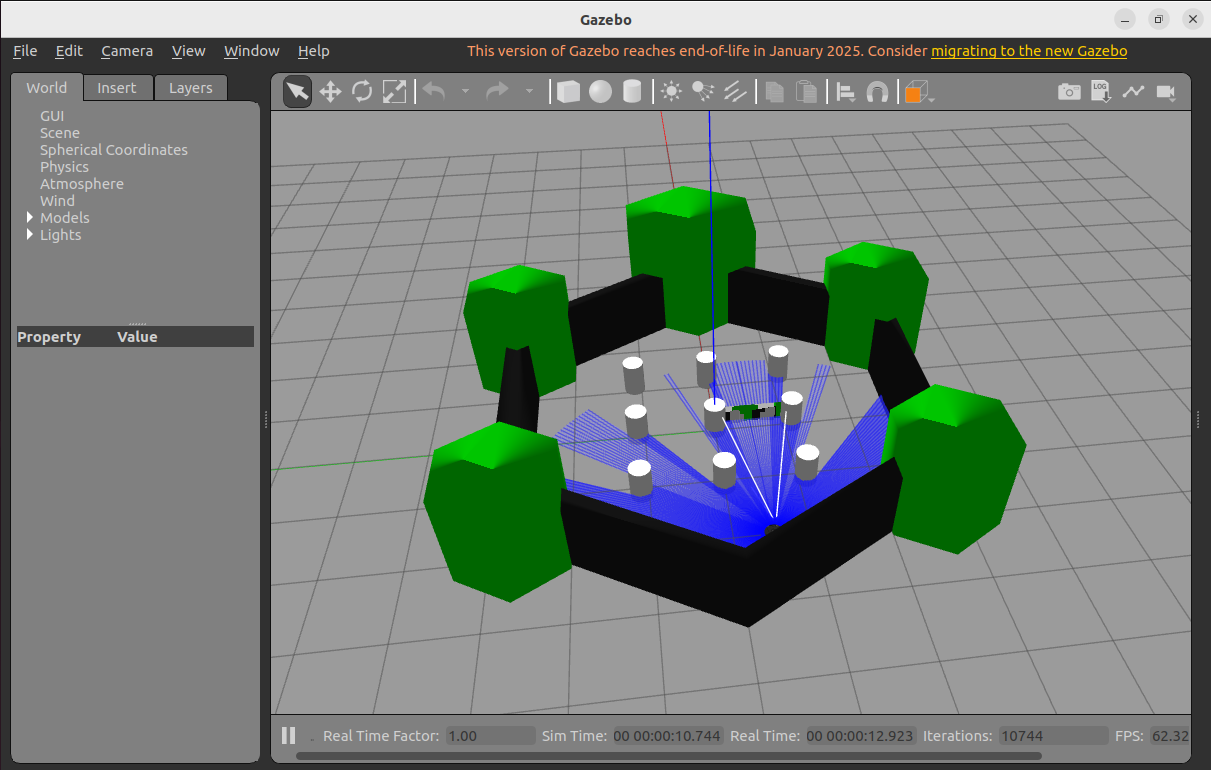
Start the Gazebo simulation environment
xxxxxxxxxxros2 launch turtlebot3_gazebo turtlebot3_world.launch.pyIt is recommended to run it in the VNC graphical desktop. SSH or RDP terminals without a correct DISPLAY may fail to show the Gazebo GUI; devices with small memory should also close other Gazebo processes first to avoid EGL errors or insufficient memory. Do not start TurtleBot3 and other Gazebo worlds in this tutorial at the same time.
3. Starting Rviz2
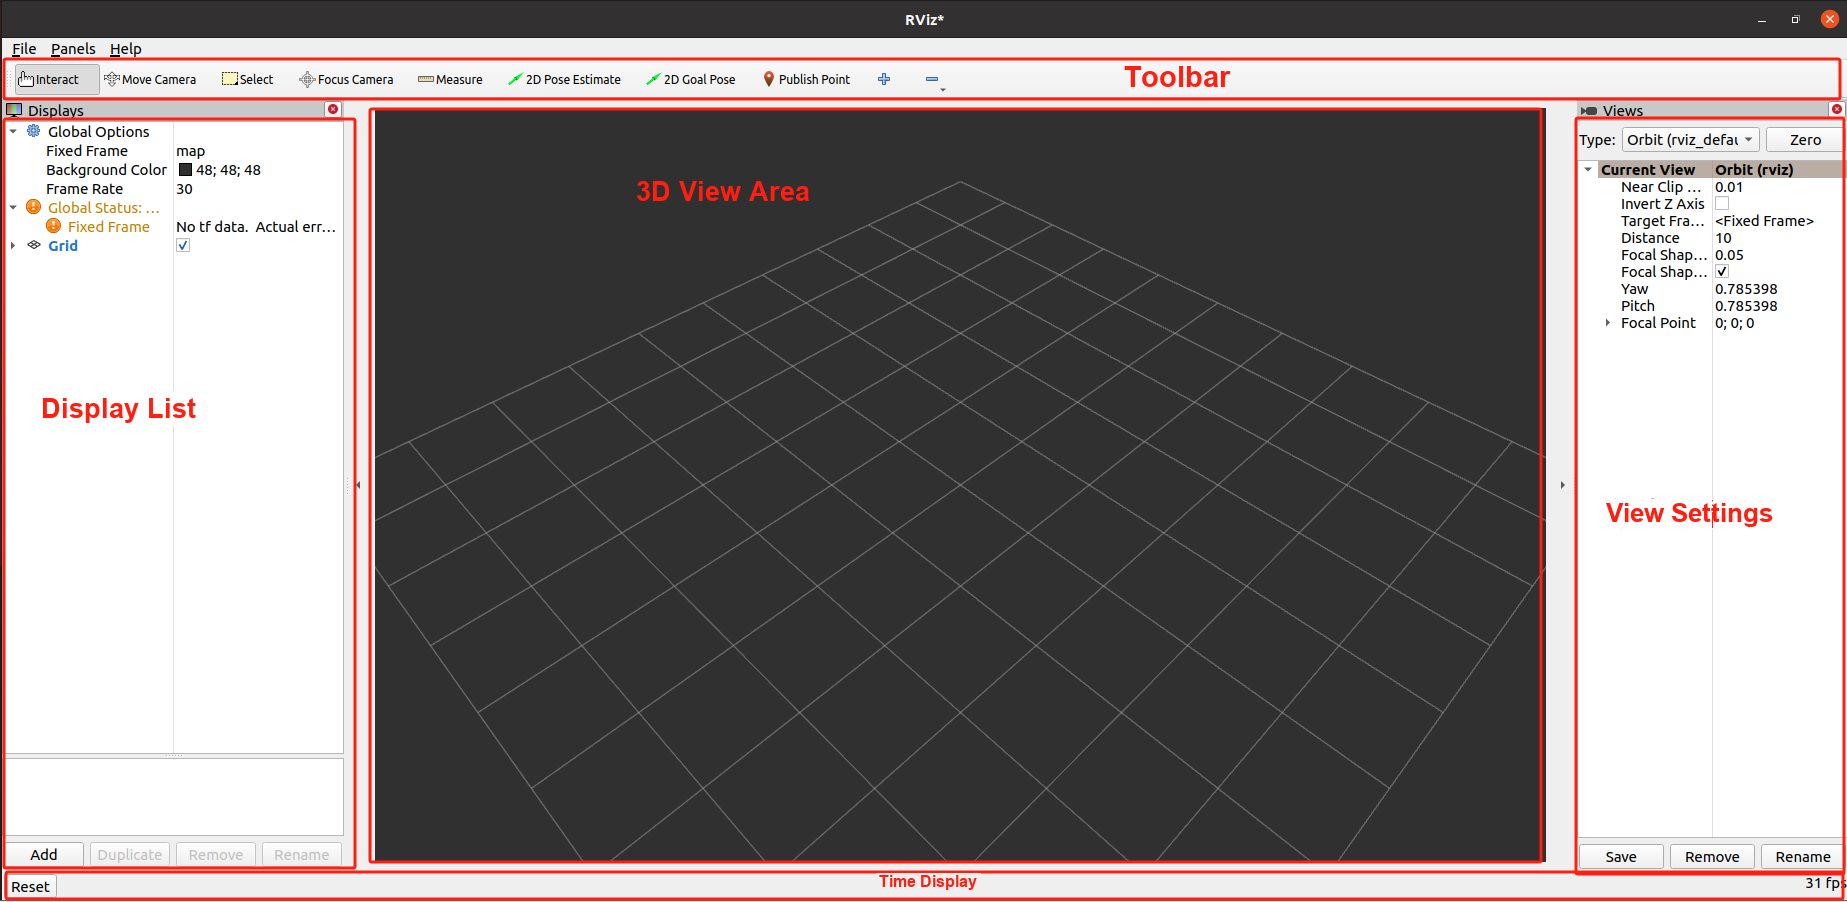
Open a terminal and use the following command to start it:
xxxxxxxxxxrviz2
If starting in Docker, make sure the GUI display is enabled.
4. Image Data Visualization
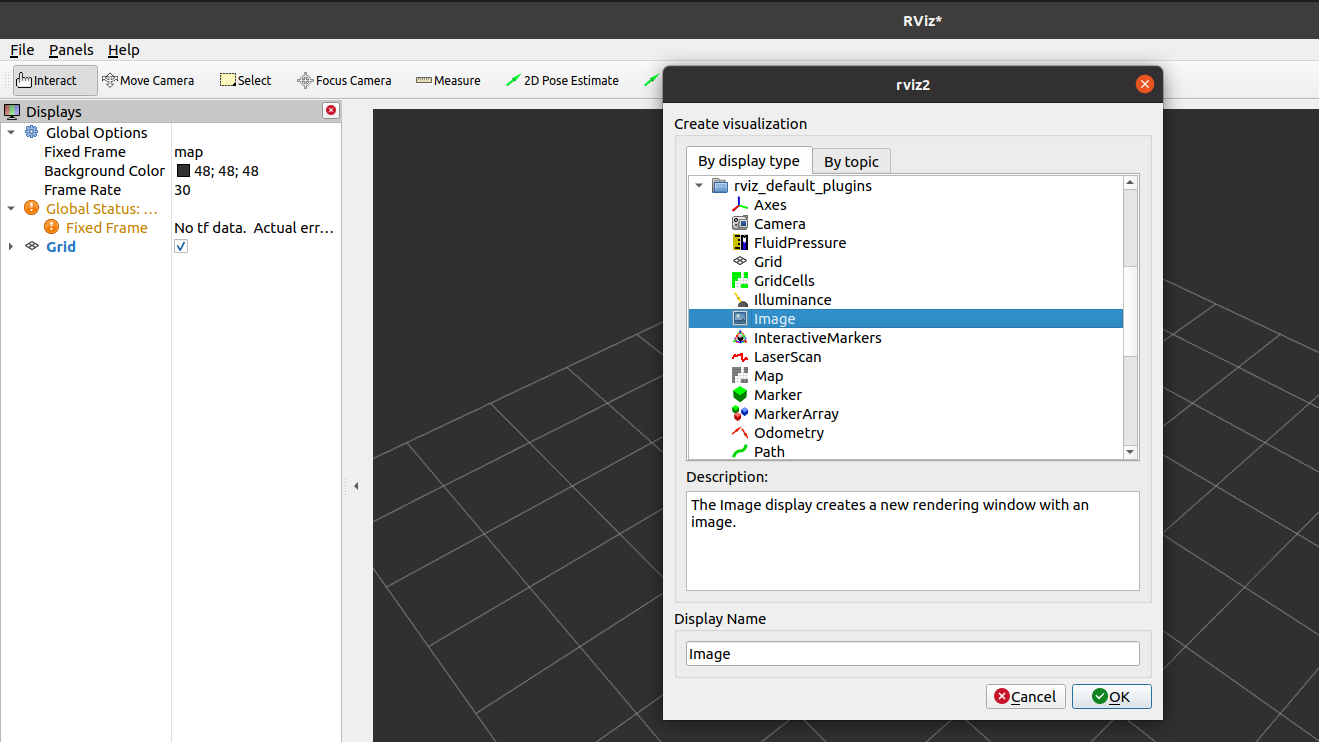
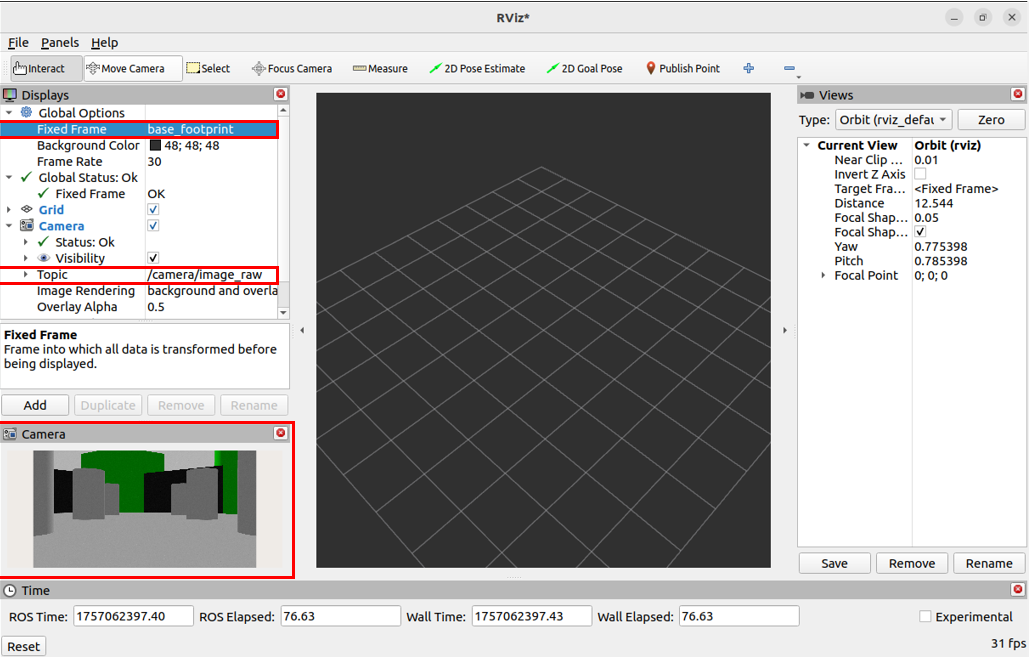
In the Displays window on the left, click "Add", find the Image display item, and confirm with OK to add it to the display list. Then configure the image topic subscribed by this display item, and you can see the robot's camera image.
Select
Fixed Frameas thebase_footprintcoordinate frame to prevent coordinate transform errorsSelect the camera color image topic
/camera/image_rawNow you can see the current view of the simulated robot in the Camera window
5. LiDAR Data Visualization
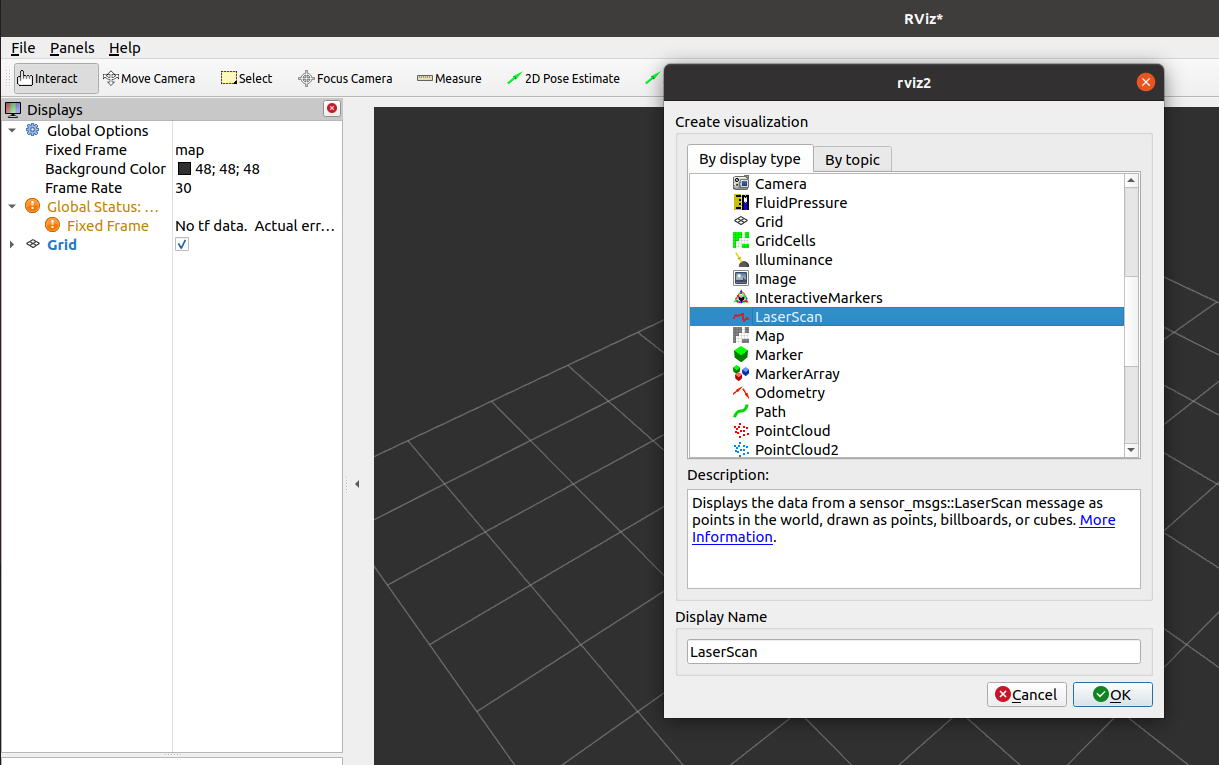
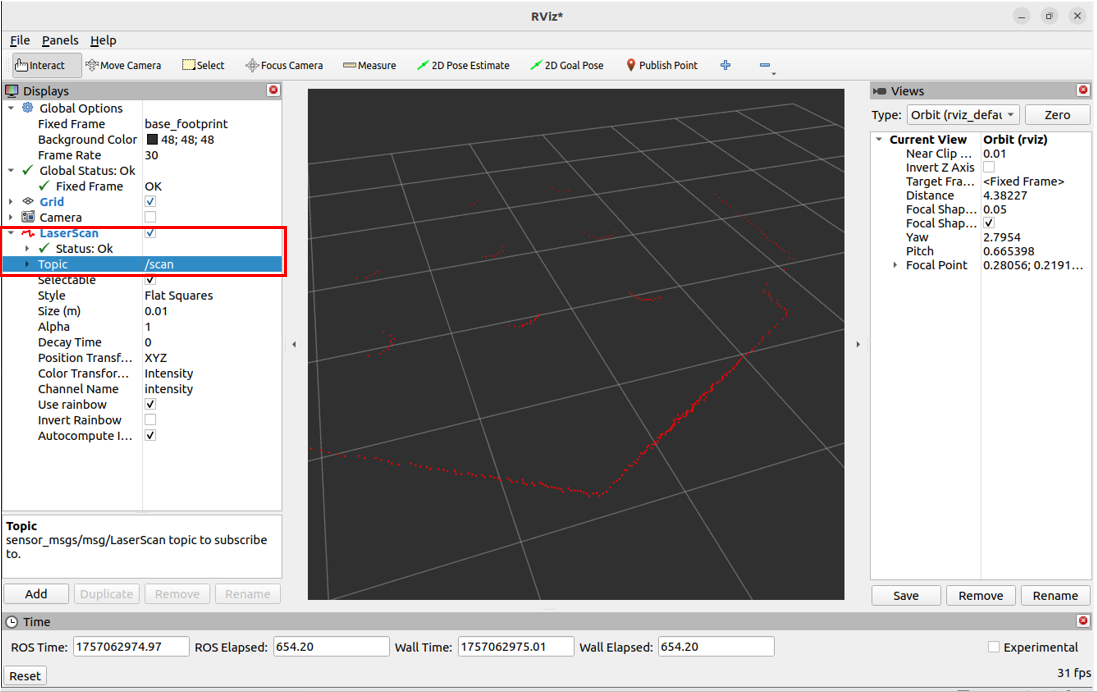
In the Displays window on the left, click "Add", select Laserscan, and then configure the subscribed topic name. The laser points are then visible.
For the
TopicofLaserScan, select/scanNow you can see the point cloud outline of the LiDAR
6. Robot Model Visualization
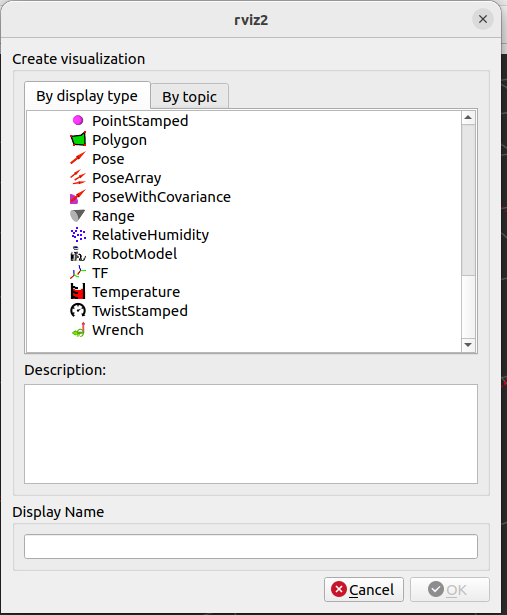
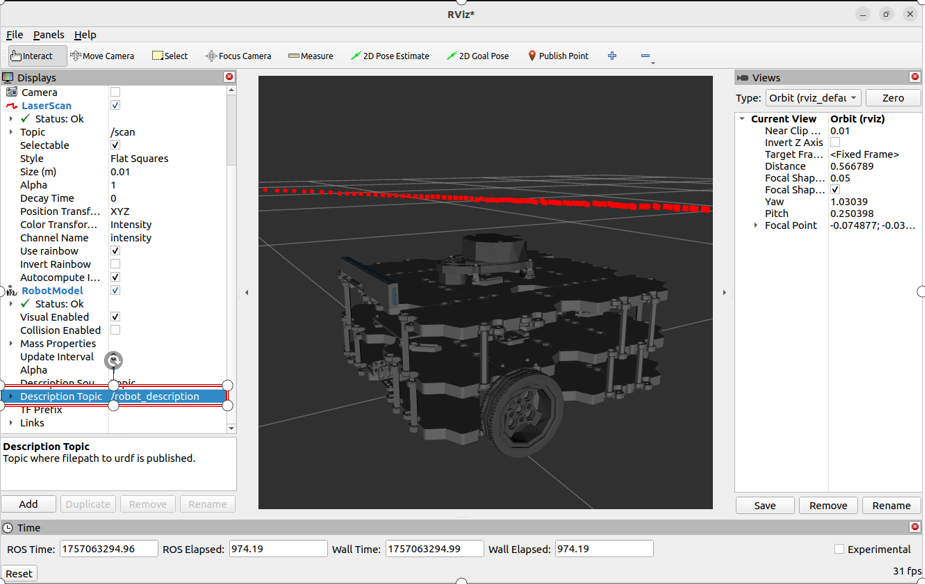
In the Displays window on the left, click "Add", and select RobotModel
In the robot's
DescriptionTopicoption, select the topic/robot_descriptionNow you can see the visualized robot model in Rviz2
7. Other Data Visualizations
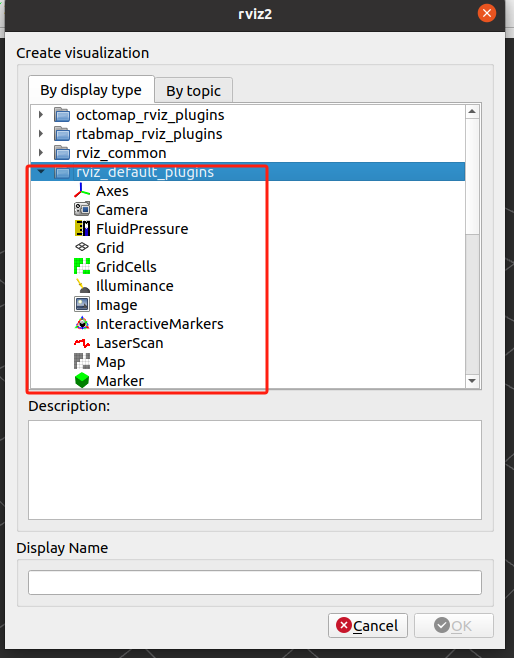
rviz_default_plugins lists many commonly used data visualization plugins; you can try them one by one.